Chapter 12.2: Production Testing & A/B Testing
Make safe, causal, repeatable improvements through production experiments
Production Testing, A/B Testing & Experimentation
What this is (and isn’t)
- Goal: make safe, causal, repeatable improvements to ML systems in production.
- Not the goal: “ship and pray” or “offline metrics decide everything”.
1) Core mental models
Mental model A — “Experiment = Causality pipeline”
You’re building a pipeline that converts a change → randomized exposure → measured outcomes → causal decision.
If any stage is weak, your conclusion is weak:
- Assignment (randomization / bucketing)
- Exposure (did users actually see the treatment?)
- Measurement (logging + metric correctness)
- Analysis (valid stats, no peeking traps)
- Decision (ship/rollback/ramp + learning captured)
Mental model B — 4 outcome types you must track
For each variant, always think in:
- Business outcomes (conversion, revenue, retention, cost)
- Model quality (task metrics, calibration, relevance, fairness slices)
- System health (latency, error rate, saturation, timeouts)
- Safety/guardrails (policy violations, risky actions, fraud, abuse)
Mental model C — “Risk ladder” for launches
Start with lowest blast radius and climb only if safe: Offline eval → Shadow → Canary → A/B → Ramp to 100%
2) Choose the right production testing method
Quick decision heuristic
- Need causal impact on user/business metrics? → A/B test
- Need safety/latency/regression confidence first? → Shadow / Canary
- Ranking/reco changes with fast feedback needs? → Interleaving (often better sensitivity than A/B)
Comparison table (what to use when)
| Method | What it answers | Best for | Pros | Cons / gotchas |
|---|---|---|---|---|
| Shadow (dark launch) | “Does it behave + perform safely under real traffic?” (no user impact) | New models, new features, infra changes | Lowest risk, great for latency/compat | No business signal; label delays still exist |
| Canary (gradual rollout) | “Is it safe at small % and stable?” | High-risk systems, new serving stack | Detects outages quickly; controlled blast radius | Not causal unless randomized + measured carefully |
| A/B test (RCT) | “Does it cause metric lift?” | Product decisions, model swaps, feature changes | Gold standard for causality | Needs enough traffic + clean instrumentation |
| Interleaving | “Which ranking is better?” with higher sensitivity | Search/reco/ranking | Faster signal, less variance | Not for arbitrary product metrics; requires ranking setup |
| Bandit (adaptive) | “Maximize reward while learning” | When opportunity cost is high | Learns while optimizing | Harder analysis; non-stationarity + bias risks |
3) Designing a production experiment (practical checklist)
Step 1 — Write the experiment contract (1 page)
- Hypothesis: “If we change X, metric Y improves because Z.”
- Primary metric (single): the one you will optimize.
- Guardrails: metrics that must not degrade beyond threshold (latency, errors, safety).
- Target population: who is eligible, who is excluded, what % holdout if needed.
- Decision rule: ship / don’t ship / iterate, and what counts as “win”.
Step 2 — Define what “success” means statistically
-
Pick:
- MDE (minimum detectable effect): smallest lift worth shipping.
- Power (common default: ~80%) and significance level (common default: 5%).
-
Decide upfront:
- Fixed-horizon (run to planned sample size) or
- Sequential testing (if you need to peek safely—use proper sequential methods, not ad-hoc)
Step 3 — Instrumentation rules (non-negotiable)
-
Log at minimum:
experiment_id,variant,assignment_id(stable),timestamp- exposure events (did treatment happen?)
- outcome events + any delayed labels linkage keys
-
Ensure idempotent logging (retries won’t double-count).
Step 4 — Guardrail-first launch
Before you care about lift, you must ensure:
- no new 5xx spikes
- no latency regressions
- no safety regressions
- no data pipeline breakage
4) The failure modes that kill experiments (and how to catch them)
1) Sample Ratio Mismatch (SRM)
Symptom: traffic split isn’t what you intended. Causes: hashing changes, eligibility bugs, bot traffic, caching, sticky sessions miswired. Practice: run SRM checks early and continuously; treat SRM as “invalid experiment until fixed”.
2) Novelty + learning effects
Short experiments can lie.
- Users react to “newness”
- Models may need time to warm up (exploration, caches, feedback loops) Heuristic: run long enough to cover at least one full behavior cycle (often weekly patterns).
3) Interference + network effects
One user’s treatment affects another’s outcome (marketplaces, social, auctions).
- Consider cluster randomization, geo splits, or careful scoping.
4) Metric invalidity
If the metric is wrong, the experiment is theatre.
- Validate metric computation with replay/backfill
- Ensure consistent definition across variants
5) Peeking without sequential methods
Stopping when p-value “looks good” inflates false positives.
- Either commit to fixed-horizon or use sequential testing correctly.
5) Metrics: how to structure them like a pro
Metric taxonomy (use this structure)
- Primary: single north-star for the experiment
- Secondary: supporting signals (diagnostics, segmentation)
- Guardrails: must-not-break (latency, error rate, safety, cost)
Slicing rules (where wins/losses hide)
Always slice results by:
- new vs returning users
- geo/device/app version
- latency buckets
- head vs tail queries (search/reco)
- cold-start vs warm-cache
- key cohorts relevant to fairness/quality
6) Production rollout strategy (recommended default)
Default rollout recipe (safe + fast)
- Shadow: verify parity, latency, resource, failure modes
- Canary (1–5%): validate stability + guardrails
- A/B (10–50%): measure causal impact
- Ramp: 50% → 100% with guardrail monitoring
- Holdout (optional): keep small control % long-term to detect drift/regressions
7) Reference architectures (Mermaid)
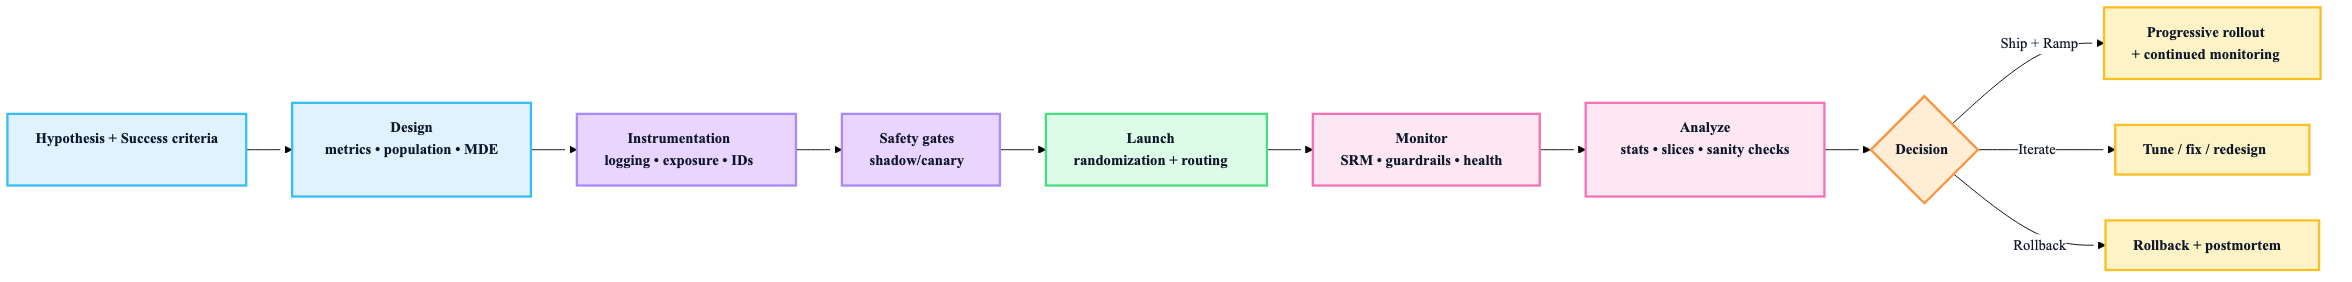
A) Experiment lifecycle
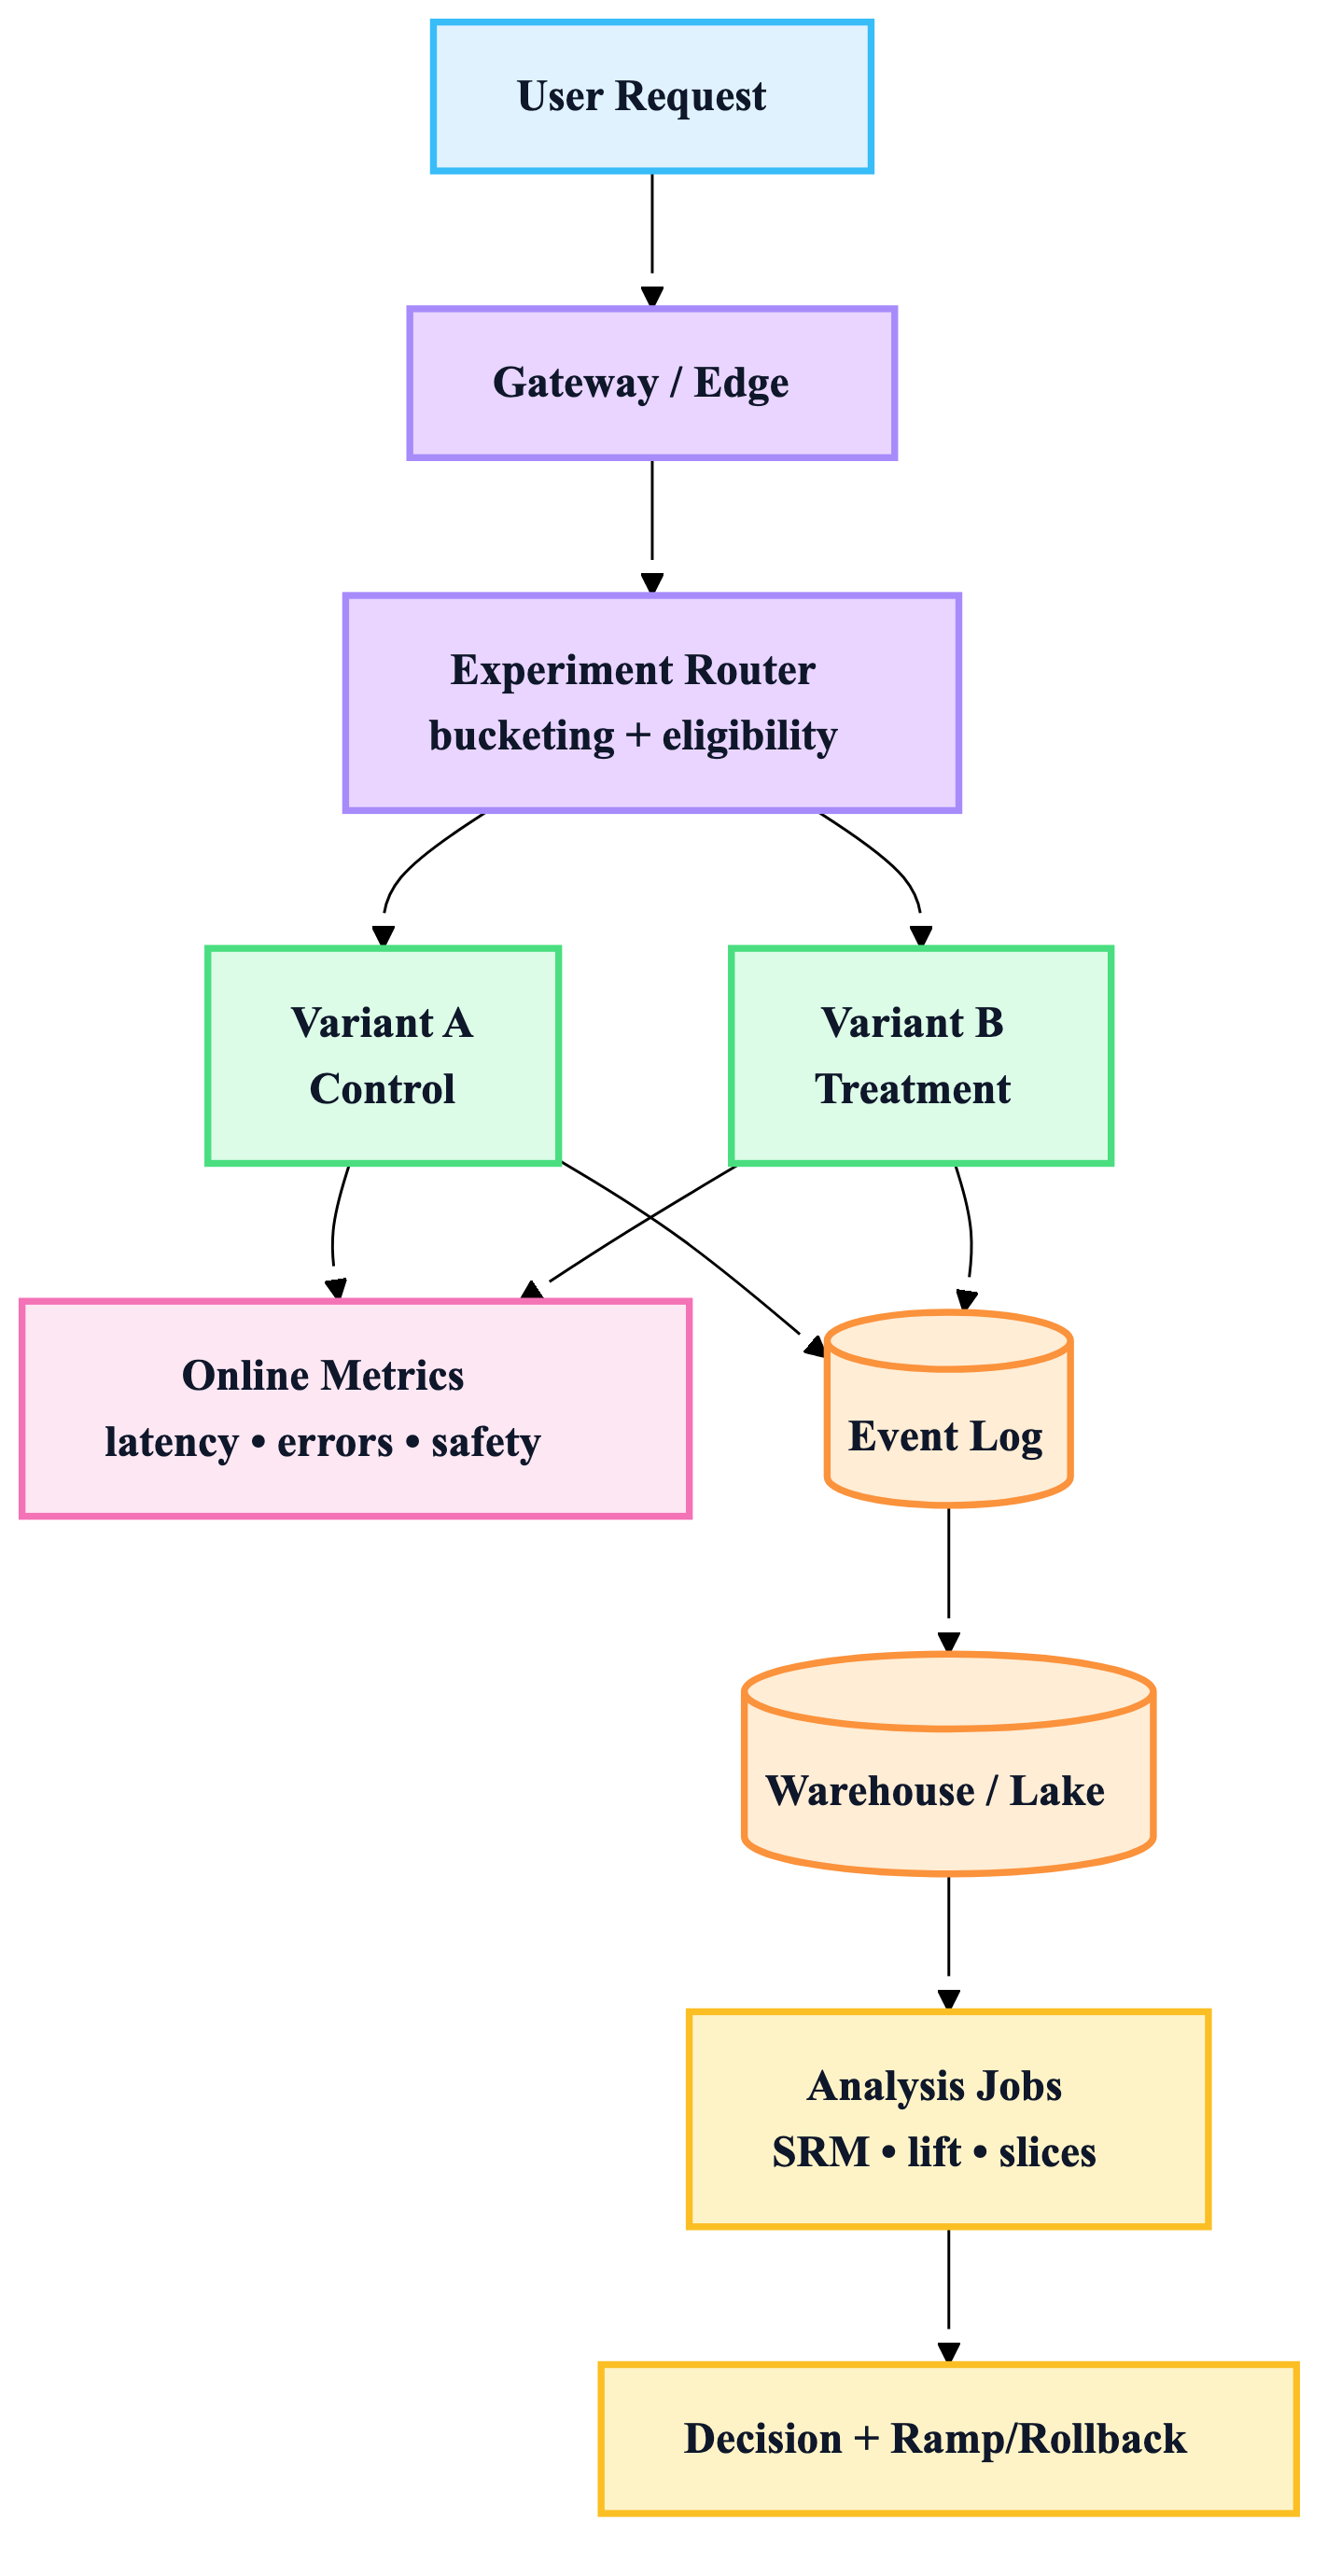
B) Traffic routing + measurement plane
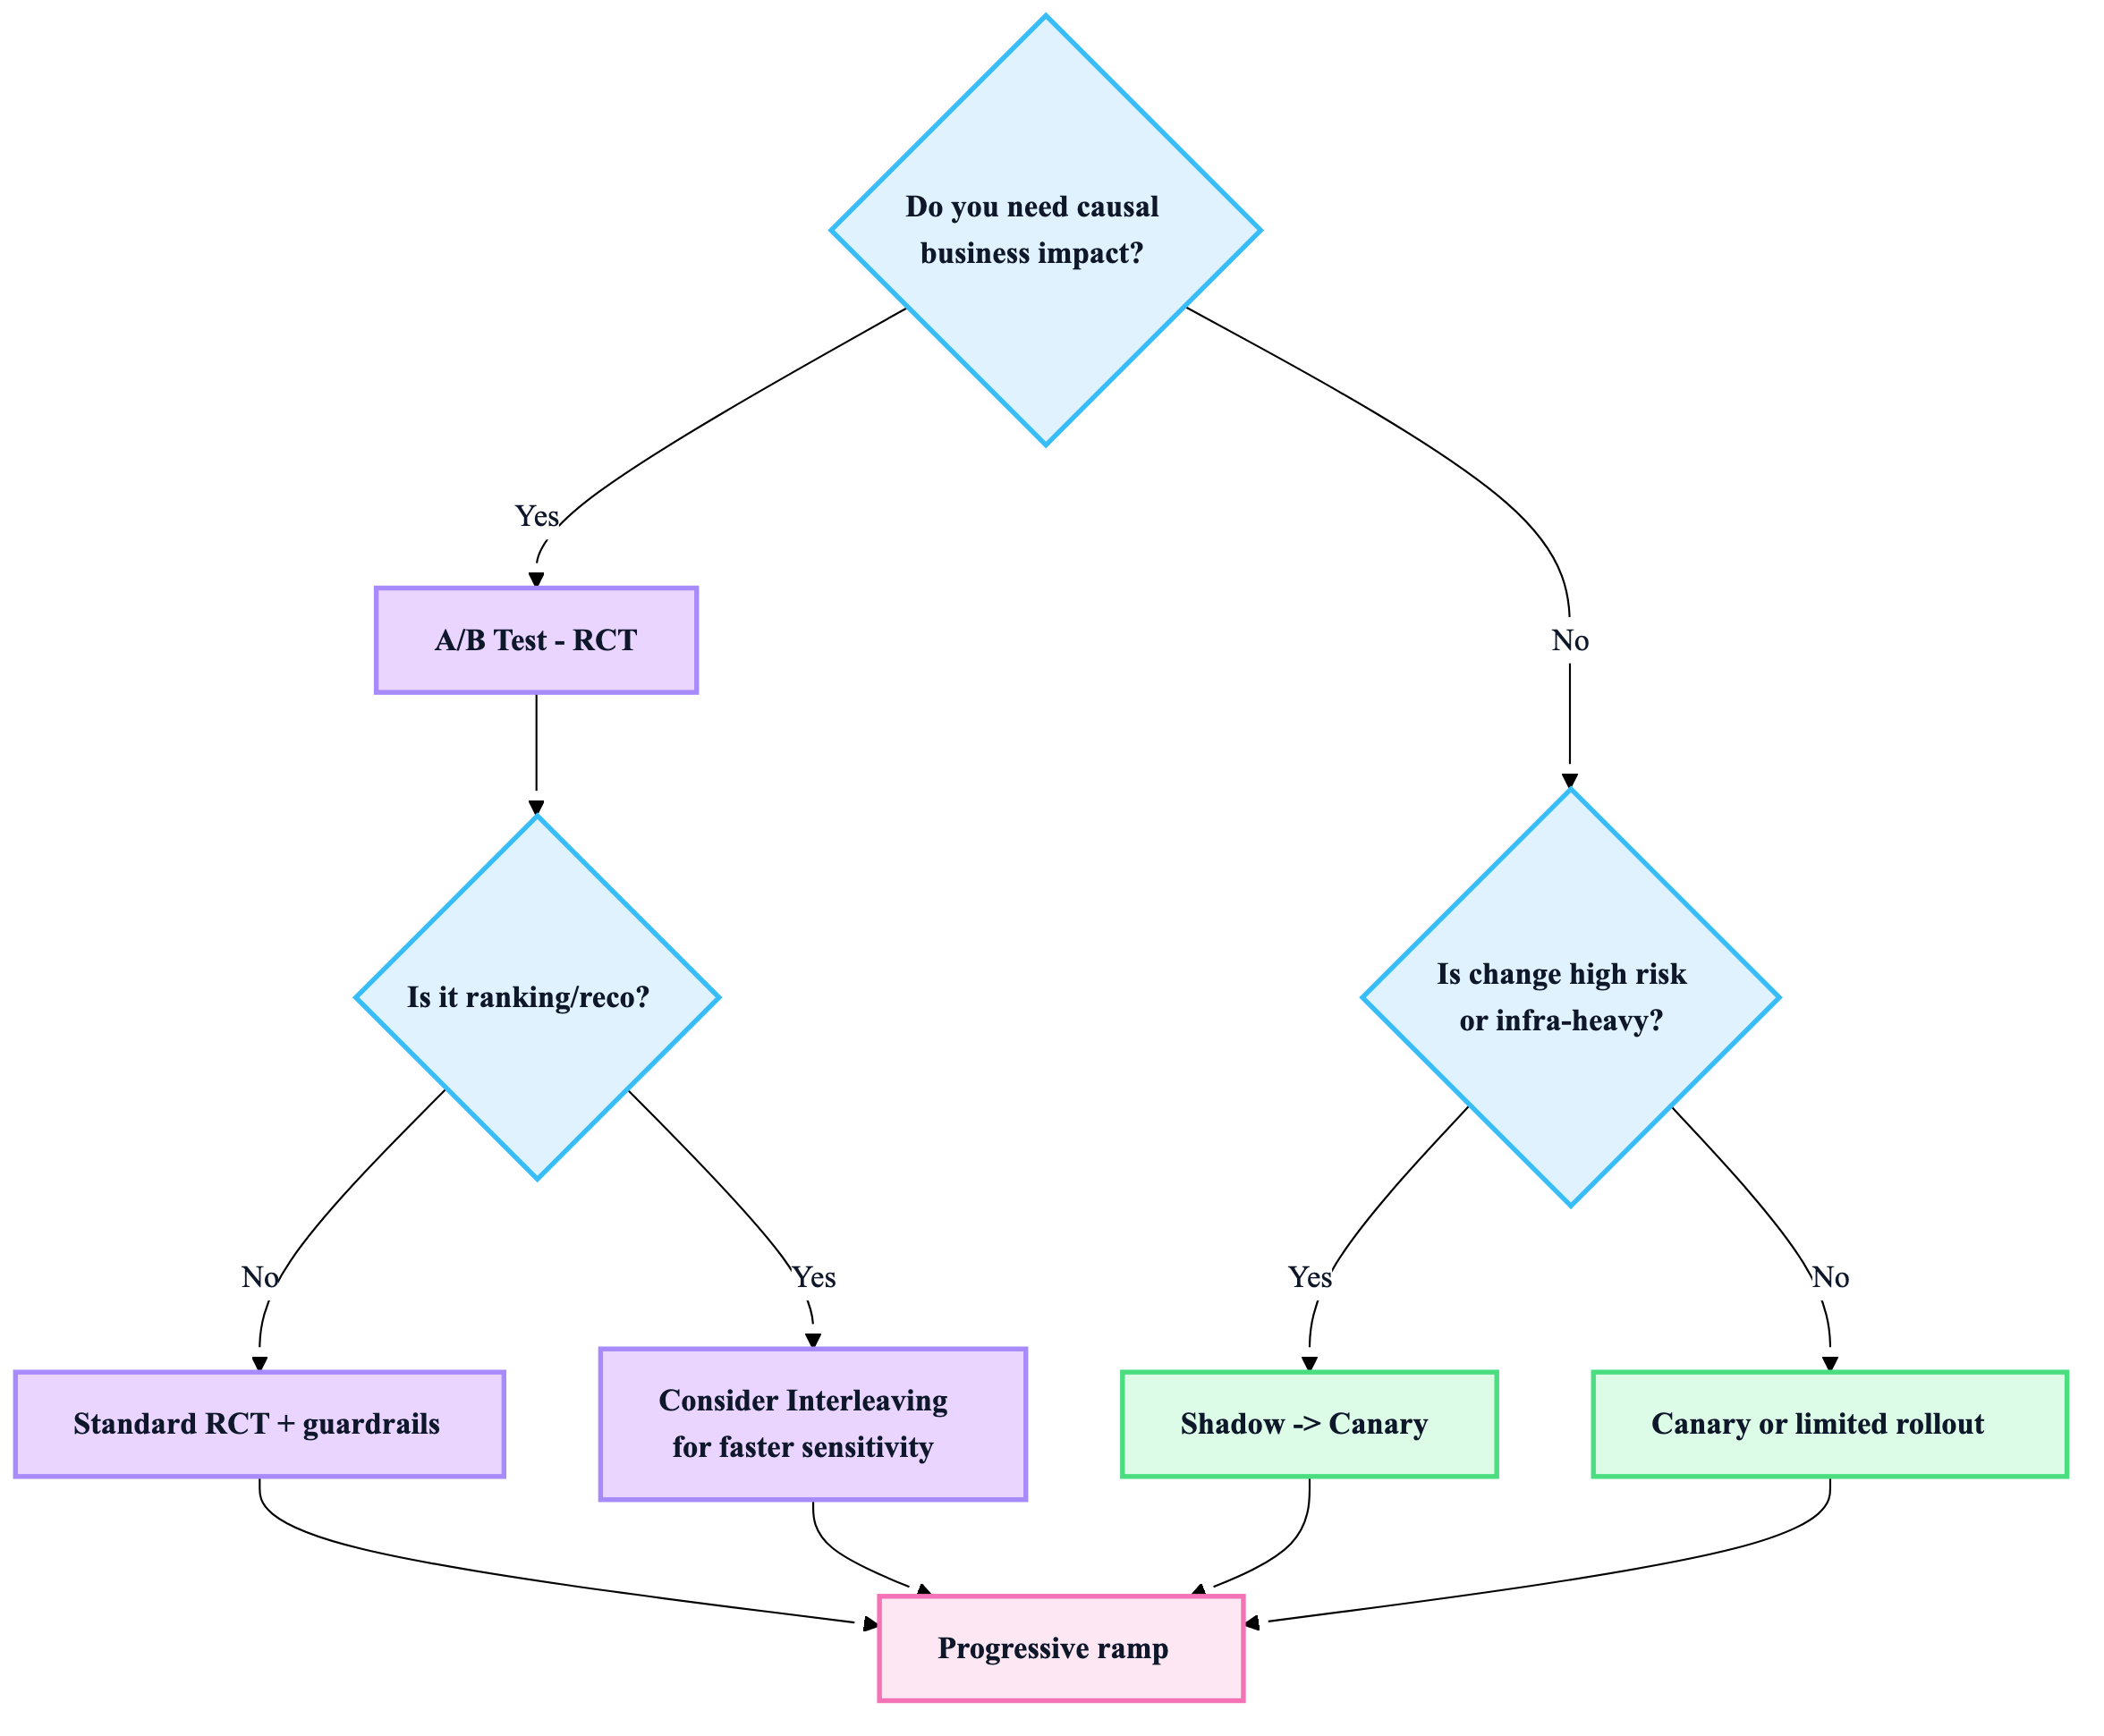
C) Choosing the method (fast decision map)
8) Operational best practices (what seasoned teams do)
“Always-on” experiment platform capabilities
- Deterministic bucketing (stable assignment)
- Feature flags + config decoupled from deploy
- Real-time guardrail dashboards
- Automated SRM detection
- Kill switch (instant disable treatment)
- Replay/backfill for delayed labels (fraud, churn, refunds)
- Decision log (why shipped, what learned)
Practical guardrail thresholds (how to think)
Instead of one hard global number:
- use SLOs (p95 latency, error budgets)
- use cost guardrails (GPU hours / request, cache hit rate)
- use safety guardrails (policy violations per 10k requests)
9) “Ship/no-ship” decision checklist (copy/paste)
- No SRM / assignment anomalies
- Guardrails within limits (latency/errors/safety/cost)
- Primary metric effect is statistically valid per planned method
- Results consistent across key slices (or you understand why not)
- No major logging gaps / exposure mismatch
- Rollback plan tested; kill switch works
- Learning captured (what worked, what didn’t, next bet)