Chapter 11.1: Failures, Monitoring & Observability
Handle ML system failures, data distribution shifts, and build observability
ML System Failures, Data Distribution Shifts, Monitoring, and Observability
The core mental model
Production ML fails in two ways:
- Hard failures (service breaks: 5xx, timeouts, bad deploys)
- Silent failures (model keeps serving but becomes wrong)
Your job is to minimize:
- TTD = Time To Detect
- TTR = Time To Resolve by building monitoring (known unknowns) + observability (unknown unknowns).
1) Monitoring vs Observability (don’t conflate)
Monitoring = “tell me it’s broken”
Track predefined metrics + alerts:
- accuracy/F1 (if labels exist)
- drift scores
- latency, error rate, uptime
Observability = “tell me why it broke”
Instrumentation that lets you debug novel issues:
- structured logs
- traces (request path across services)
- feature/prediction snapshots
- evaluation store (inputs, outputs, actuals, versions, explanations)
Rule: Monitoring pages you; observability fixes it.
2) Failure taxonomy (what to expect in real systems)
A) Non-ML failures (classic software)
- dependency/API breaks
- deployment misconfig / wrong model version
- hardware/resource failures
- downtime/crashes
B) ML-specific failures (often silent)
- data quality issues (missingness spikes, wrong units, schema drift)
- training-serving skew (mismatch exists from day 1)
- data distribution shifts (drift over time)
- edge cases (rare inputs where model collapses)
- feedback loops (model decisions bias future data)
- cascading failures in multi-model chains (upstream changes break downstream)
- adversarial behavior (in high-risk domains)
Heuristic: If it can degrade quality without throwing an exception, it must be monitored + traced.
3) Data observability: the 5 pillars (minimum bar)
- Freshness: is data up-to-date?
- Distribution: are stats within expected ranges?
- Volume: row count / event count as expected?
- Schema: columns/types changed?
- Lineage: where did it come from and who depends on it?
Rule: Alert first on freshness/schema/volume. They catch the most damaging failures fast.
4) ML observability: the 4 pillars (production bar)
- Performance (when labels exist): quality metrics + slice metrics
- Drift: input drift + prediction drift + (when possible) label shift
- Data quality: missingness, range, cardinality, outliers
- Explainability: global/cohort/local attribution to debug “why”
Heuristic: Most “model drift” incidents are actually data pipeline issues until proven otherwise.
5) Drift types (know what you’re measuring)
Let training be P_source(X, Y) and production be P_target(X, Y). Drift when they differ.
| Drift type | What changes | Intuition | Practical signal | |
|---|---|---|---|---|
| Covariate shift | P(X) |
“inputs look different” | feature distribution drift | |
| Label shift | P(Y) |
“class priors changed” | label rate changes (if labels) | |
| Concept drift | `P(Y | X)` | “same input now means different output” | performance drop w/ weak input drift |
| Schema drift | features set/meaning | “feature changed/renamed/unit bug” | schema/range/type breaks | |
| Prediction drift | P(ŷ) |
“model outputs shifted” | output distribution drift | |
| Training-serving skew | mismatch at launch | “bad from day 1” | prod metrics never reach offline |
Rule: Don’t over-interpret drift scores. Drift ≠ harm unless it impacts performance or business KPIs.
6) Detection playbook (what to monitor depending on label availability)
Case A: Labels arrive quickly (<24h)
- primary: task metrics (AUC/F1/MAE/NDCG)
- secondary: drift + DQ + slice metrics
Case B: Labels delayed (weeks/months)
- primary: prediction drift + input drift + DQ
- secondary: proxy metrics (engagement, disputes, corrections)
Case C: Labels are biased (model affects label observability)
- use holdouts / exploration (randomization) to estimate true performance
- monitor fairness + outcome rates carefully
Case D: No labels
- drift + DQ + embedding drift (for unstructured)
- human review sampling for a thin “truth stream”
Heuristic: Most orgs need “label-free early warning” + “delayed label confirmation.”
7) Drift metrics (pick simple, robust defaults)
First-pass (cheap + interpretable)
- summary stats: mean/std/quantiles, missing %, cardinality
- schema and type checks
Statistical tests / distances (common)
- KS test (continuous, 1D)
- Chi-squared (categorical)
- PSI (binned; classic in risk)
- KL / JS divergence (binned; JS is symmetric and finite)
Important pitfall: binning strategy can dominate the drift score (define stable bins; handle OOD bins).
Heuristic: For most production systems: start with PSI + missingness + cardinality + prediction drift, then add more only if needed.
8) The “drift triage” workflow (what to do when alerted)
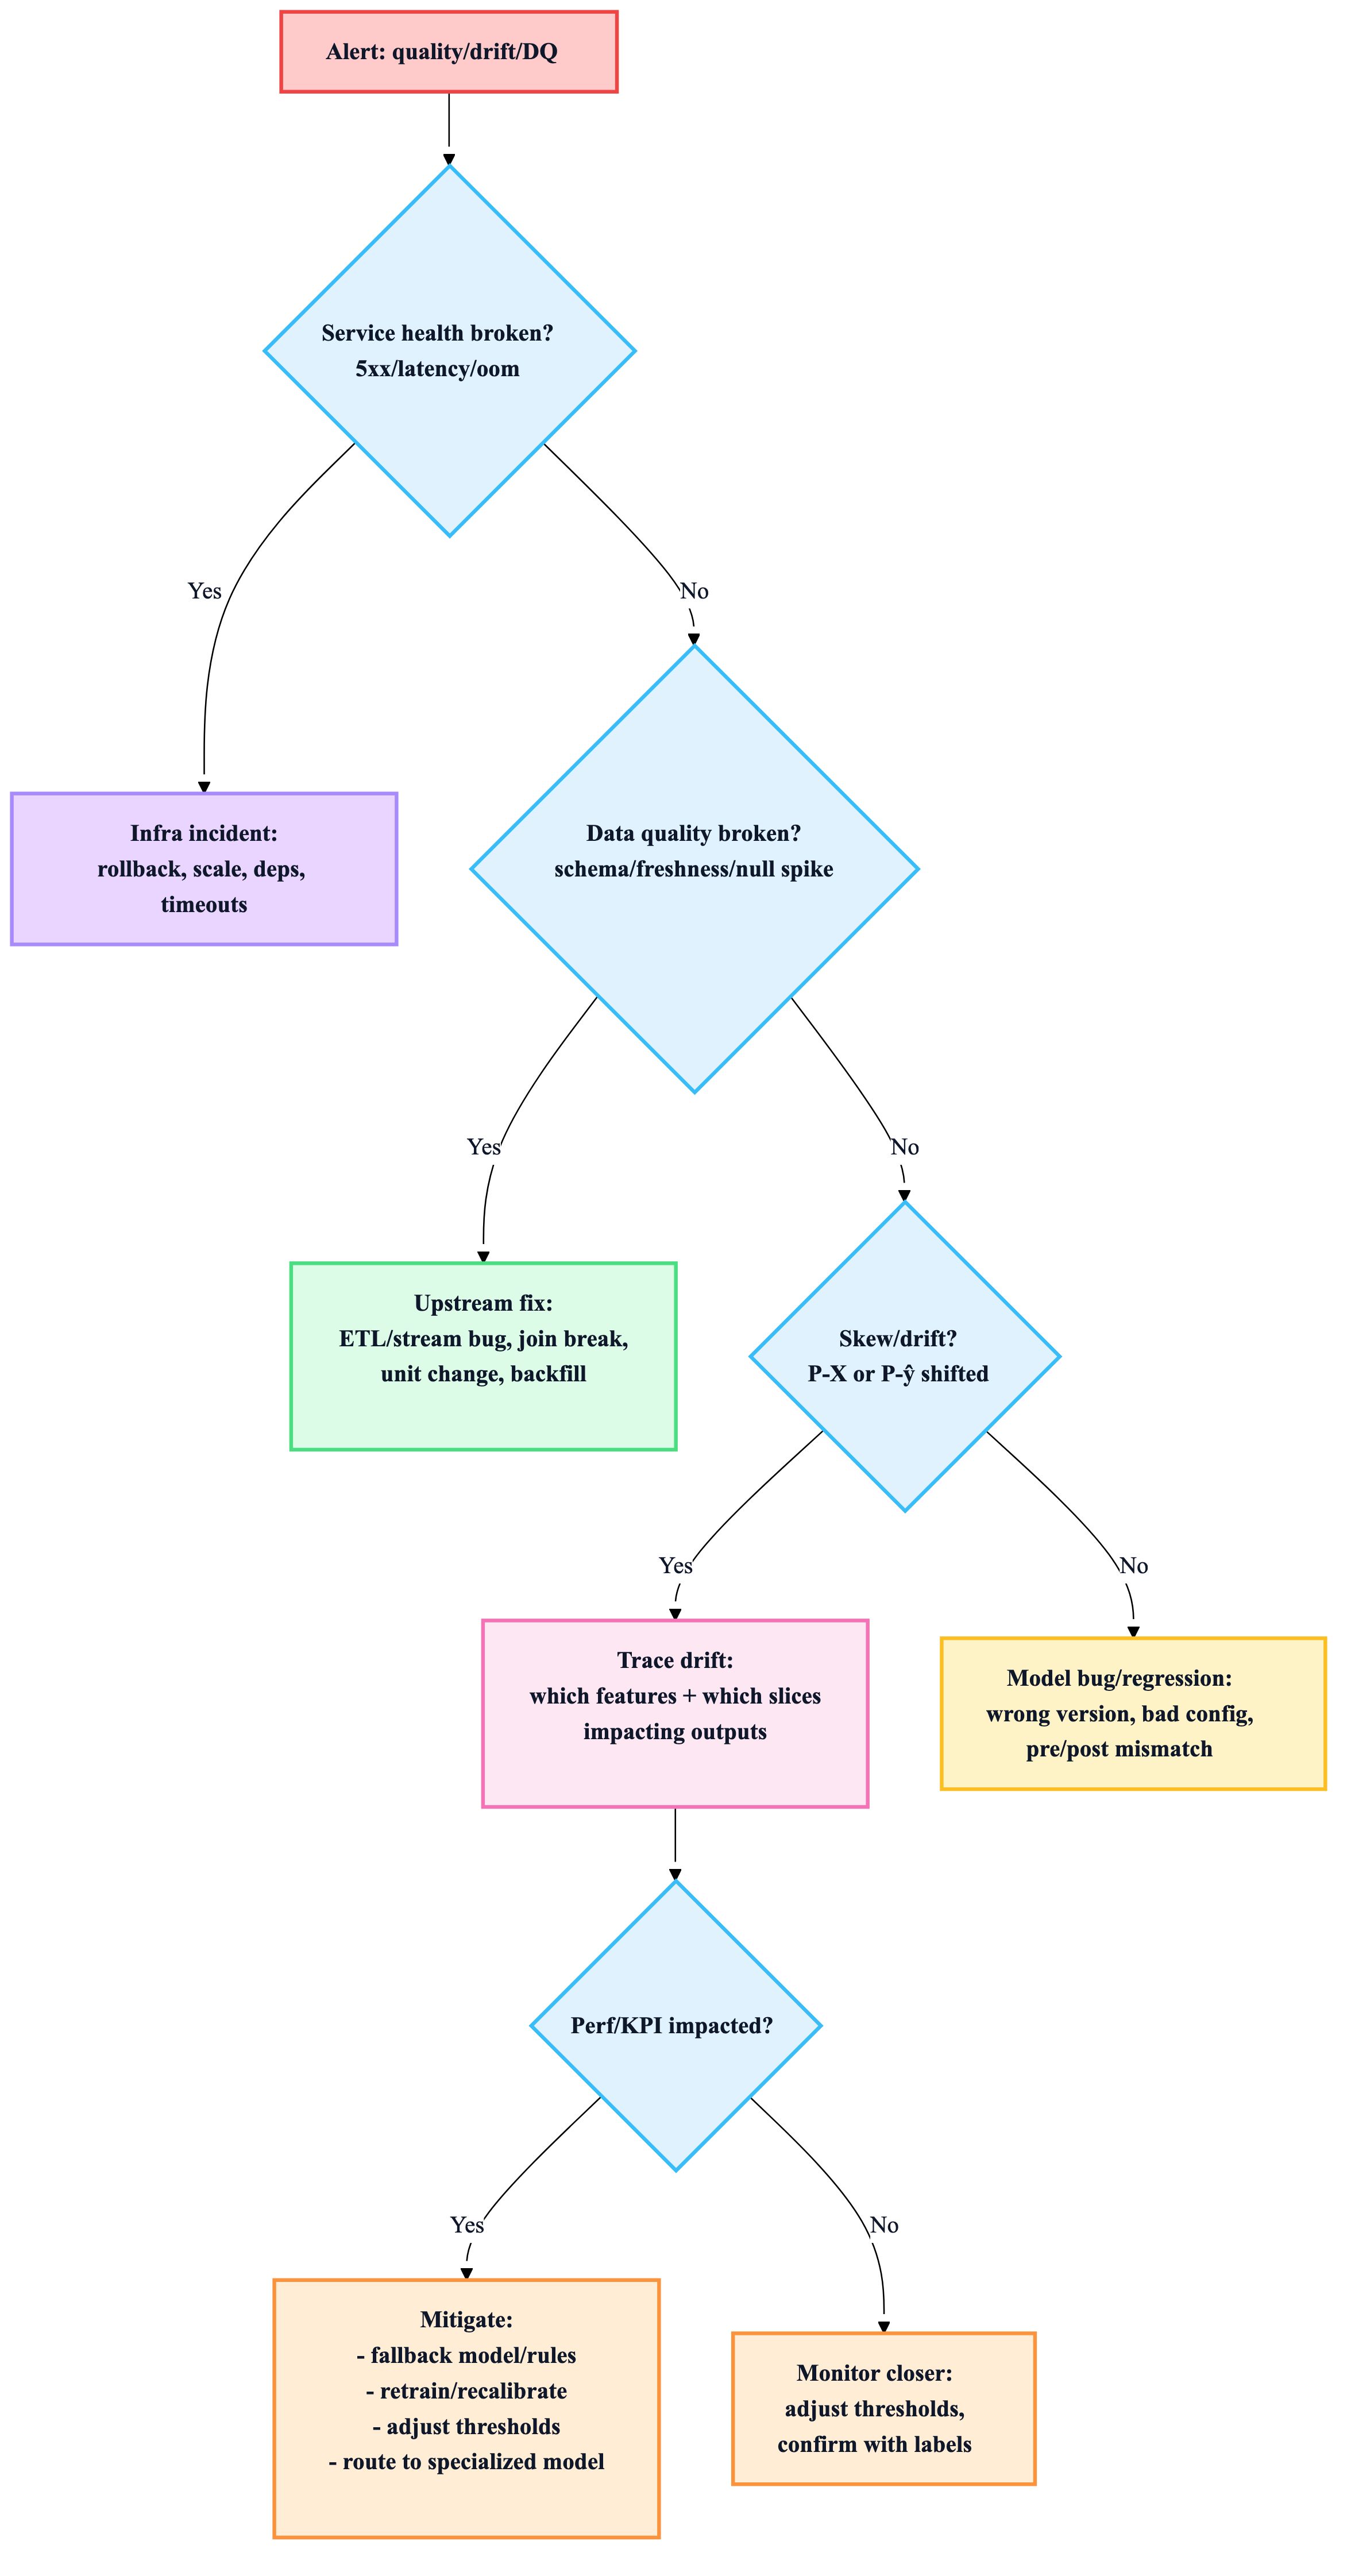
Rule: Fix pipeline bugs before retraining. Retraining on corrupted data just bakes in failure.
9) Mitigation strategies (ordered by “fastest safe win”)
A) Operational fixes (minutes–hours)
- rollback to champion model
- traffic shaping / canary pause
- enforce schema constraints, fallback defaults
- tighten rate limits, caching, batch inference temporarily
B) Data fixes (hours–days)
- repair upstream pipeline
- backfill corrected data
- patch feature transformations (training/serving parity)
C) Model fixes (days–weeks)
- retrain with newer distribution (stateless)
- fine-tune/incremental learning (stateful; watch forgetting)
- recalibrate probabilities / thresholds
- specialized models + routing for heterogeneous regimes
Heuristic: Use specialized models when the world splits into stable “regimes” (geos/markets/segments).
10) Feedback loops & cascading failures (two real production traps)
Feedback loops (recs, lending, hiring)
- the model shapes the data it later trains on
- leads to popularity bias, exposure bias, survivorship bias
Mitigation patterns
- exploration/randomization (small holdout)
- contextual bandits (smarter exploration)
- position features / two-model decomposition (visibility vs click)
Cascading failures (model chains)
If Model A’s output feeds Model B:
- changing A shifts B’s input distribution and can break B
Rule: Monitor input/output distributions at every hop in the chain.
11) Unstructured data, embeddings, and LLM monitoring (what changes)
Embedding drift (high leverage for text/image/audio)
Track drift using:
- average distance to baseline neighbors (cosine/Euclidean)
- centroid distance shifts
- UMAP visualization for investigation (periodic)
Heuristic: For high-cardinality categories/text, embedding drift is often more stable than “top-N category counts.”
LLM apps (LLMOps essentials)
Monitor:
- token usage (cost), latency
- prompt/template version
- response quality (judge score / human feedback)
- safety/toxicity (if relevant)
- RAG retrieval stats (hit rate, source coverage)
- trace of agent/tool calls (step failures)
Rule: In LLM systems, observability must include traces (prompt → retrieval → tool calls → response), not just final outputs.
12) The “evaluation store” (your observability backbone)
Store, per prediction (and per version/environment):
- input payload + feature values
- model output + confidence
- model/version/prompt/version metadata
- ground truth (when arrives)
- explanation artifacts (e.g., SHAP)
- slice tags (geo/device/segment)
- trace IDs linking to logs
Heuristic: If you can’t reconstruct “what happened for this request,” you’ll never debug production effectively.
13) Alerting rules that actually work (anti-noise)
Start with high-signal alerts
- schema changes
- freshness lag
- missingness spikes
- prediction distribution shift (big + sustained)
- p99 latency / error spikes
- cost anomalies (LLM tokens, GPU utilization)
Then add model-quality alerts
- task metric drops (once labels are reliable)
- slice regressions (critical cohorts)
- fairness parity thresholds (where required)
Rule: Alerts must be actionable and link to a runbook + dashboard, or they create fatigue.
Copy/paste: Monitoring checklist (minimum viable production)
- Service health: p50/p95/p99 latency, QPS, error rate, saturation
- Data: freshness, schema, volume, missingness, range checks
- Drift: input drift + prediction drift (stable baselines + windows)
- Slice dashboards for critical cohorts
- Evaluation store (inputs/outputs/versions/trace IDs)
- Rollout safety: canary/shadow + rollback tested
- Runbooks for: infra incident vs data incident vs model incident
- Retraining triggers + validation gates (don’t auto-retrain blindly)