Are Ed Sheeran's Shape of you and Sia's Cheap thrills rhythmically similar ?
How to measure rhythmic similarity of two songs ? Can we visualize the rhythm of a song ? How to determine the most and least unique songs ?
January 2020
Why this project ?
At some point while listening to music we have all wondered if the song we are listening to sounds a lot like some other song ? This is not suprising since artists have always tried to churn out new rhythm patterns based on successful music that came out earlier. This makes perfect sense with research suggesting that people tend to like certain kind of rhythm patterns more than others. But quite often such similarities are based on listener's perception and is therefore highly subjective. This leads us to seek if there is a way to measure the rhythm similarities of two songs quantitatively.
So how to measure rhythmic similarity of two songs ? Can we classify the songs based on their rhythm patterns ? Can we visualize the rhythm of a song ? If we can assign similarity scores to songs, then can we determine the most unique song and the most similar sounding song pairs ? Further by combining uniqueness of songs belonging to a certain artist, can we measure uniqueness of an artist ? This post attempts to answer these questions.
About dataset
Before we begin, a note about the dataset used in the project. This project uses MIDI data to compare rhythm patterns of songs. MIDI (short for Musical Instrument Digital Interface) carries event messages, data that specify the instructions for music, such a note's notation, pitch, velocity and tempo of the song. The MIDI data was personally collected from Musescore. We considered artists by total number-one singles on Billboard Hot 100 chart for every decade from 1960s. For each artist, we then obtained MIDI data of all the songs available on Musescore. For artists from before 2000s, MIDI data were available for only few songs. So in order to expand the dataset, we also considered popular artists of 2000s and 2010s not in the Billboard Hot 100 chart. Overall the dataset consists of MIDI data for close to 400 songs. Although this is still a small dataset, the analysis that follows here does provide interesting insights into visualizing and measuring similarities in rhythm patterns of songs.
Storyboarding
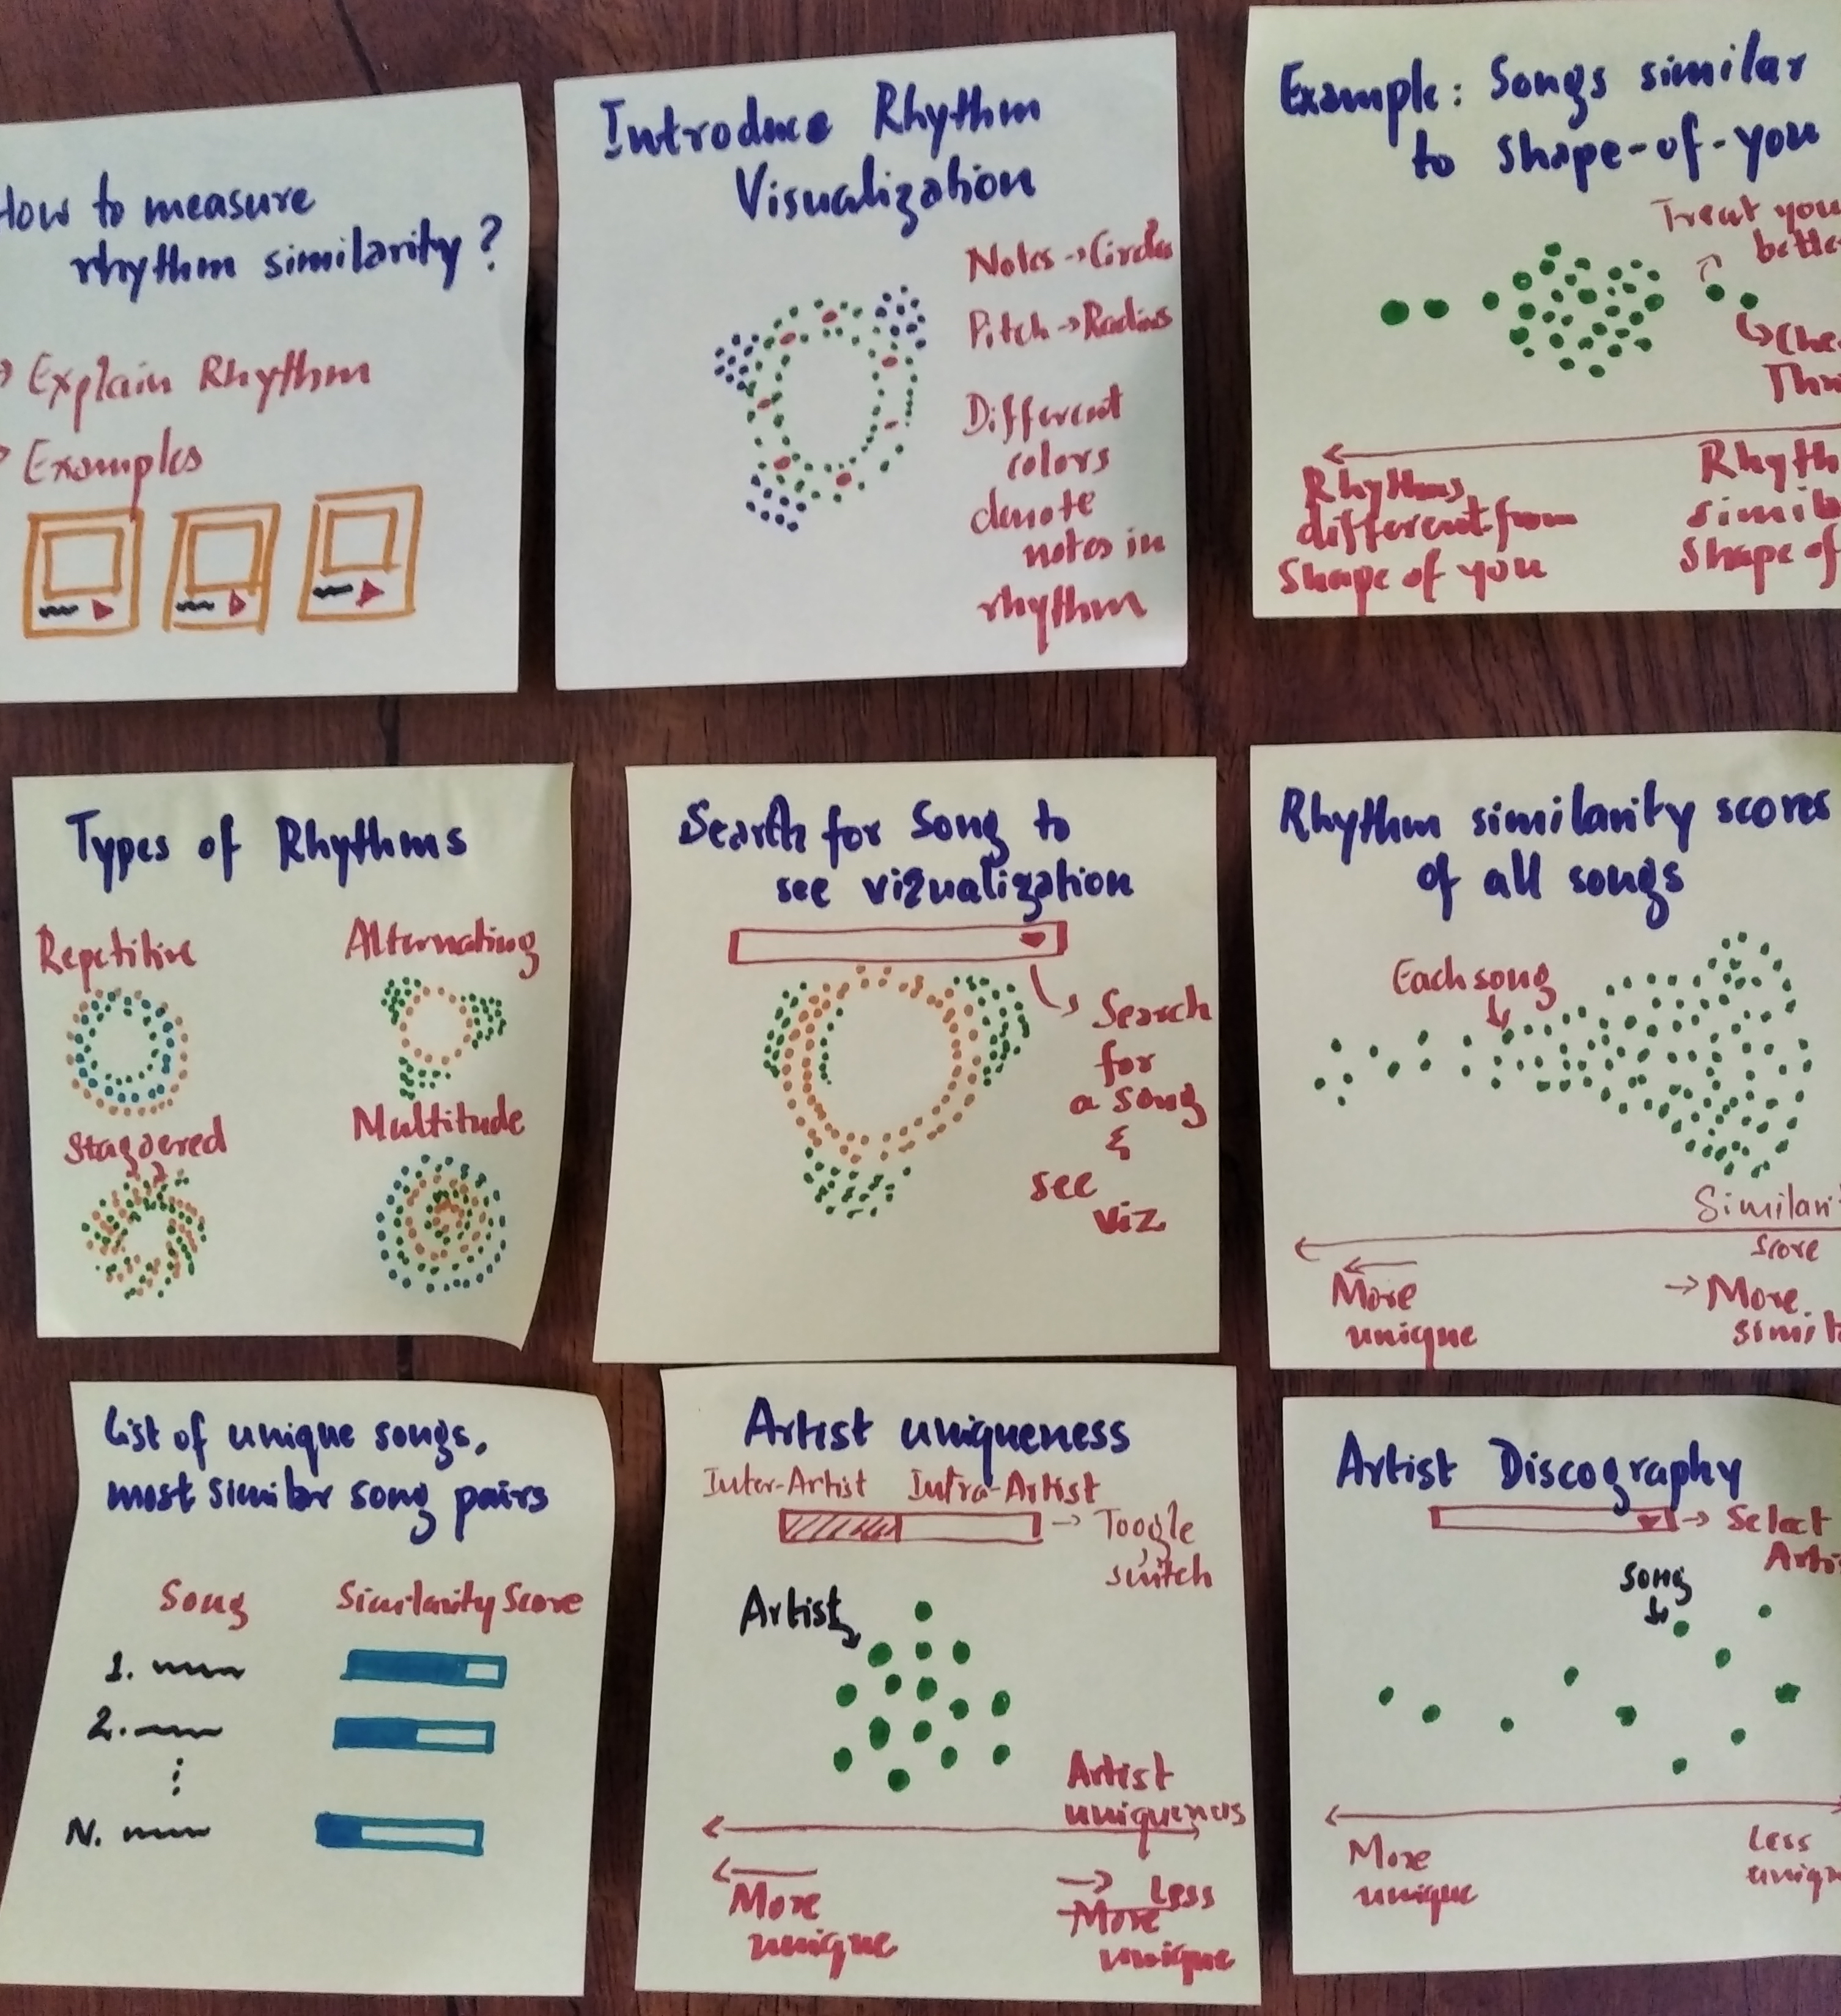
Rhythm Visualization
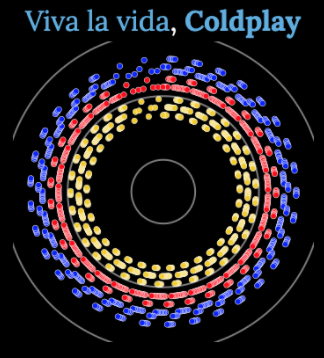
Each note in the song is shown as a circle. The pitch of the note determines the distance of the circle from center. The colors denote the various notes present in the song. The space between the circles are based on the on and off duration of the notes. Together these features constitute a rhythm pattern. Based on this, we can now plot the rhythm pattern of an entire song. We can plot the rhythm over time horizontally but instead let us do it in a circular fashion. This will help us visualize better the repetitive patterns present in the song. So now the rhythm patterns will be shown as circles with clockwise direction representing increasing time.
As an example, here is the visualization of rhythm pattern of the song "Viva La Vida" by Coldplay.
Inspired from
The Pudding article by Colin Morris - Are Pop Lyrics Getting More Repetitive?