Alternate Search Rankings for Airbnb

The project involved coming up with alternate search rankings based on Listing Vibe, Aesthetic Quality of listings photos and using A/B testing for comparing different search rankings.

What are the goals of the project ?

Alternate Searches: Come up with novel alternate ways of searching Airbnb listings with an aim of making it easier for users to find listings of their most appropriate choice.

  • Listings Vibe: Determine vibe of listing based on Topic Modeling on listing description.
  • Image Aesthetics: Sort listings based on image aesthetics as determined by Deep Learning Image Assessment Model

About Dataset

The Dataset used in this project was obtained from public.opendatasoft.com. There are a total of 494,954 records each of which contains details of one Airbnb listing. The total size of dataset is 1.89 GB.

The dataset has a large number of features which can be categorised into following types,

  • Location related: Country, City, Neighbourhood
  • Property related: Property Type, Room Type, Accommodates, Bedrooms, Beds, Bed Type, Cancellation Policy, Minimum Nights
  • Booking Availability: Availability 30, Availability 60, Availability 90, Availability 365
  • Reviews related: Number of Reviews, Reviews per Month, Review Scores Rating, Review Scores Accuracy, Review Scores Cleanliness, Review Scores Checkin, Review Scores Communication, Review Scores Location, Review Scores Value
  • Host related: Host Since, Host Response Time, Host Response Rate, Calculated host listings count, Host Since Days, Host Has Profile Pic, Host Identity Verified, Is Location Exact, Instant Bookable, Host Is Superhost, Require Guest Phone Verification, Require Guest Profile Picture, Requires License
  • Text Features: Listing Description, House Rules, Neighbourhood Description
  • Image URL: Link to listing image (one per listing)

For this project, the following features will be used,

  • Text Features such as Listing Description, House Rules, Neighbourhood Description in order to determine Listing Vibe based on Topic Modelling.
  • Listing Images to search by Image aesthetics

Search by Image Aesthetics: Using pre-trained Deep Learning Model to assess image quality

Why search by image quality and aesthetics ?

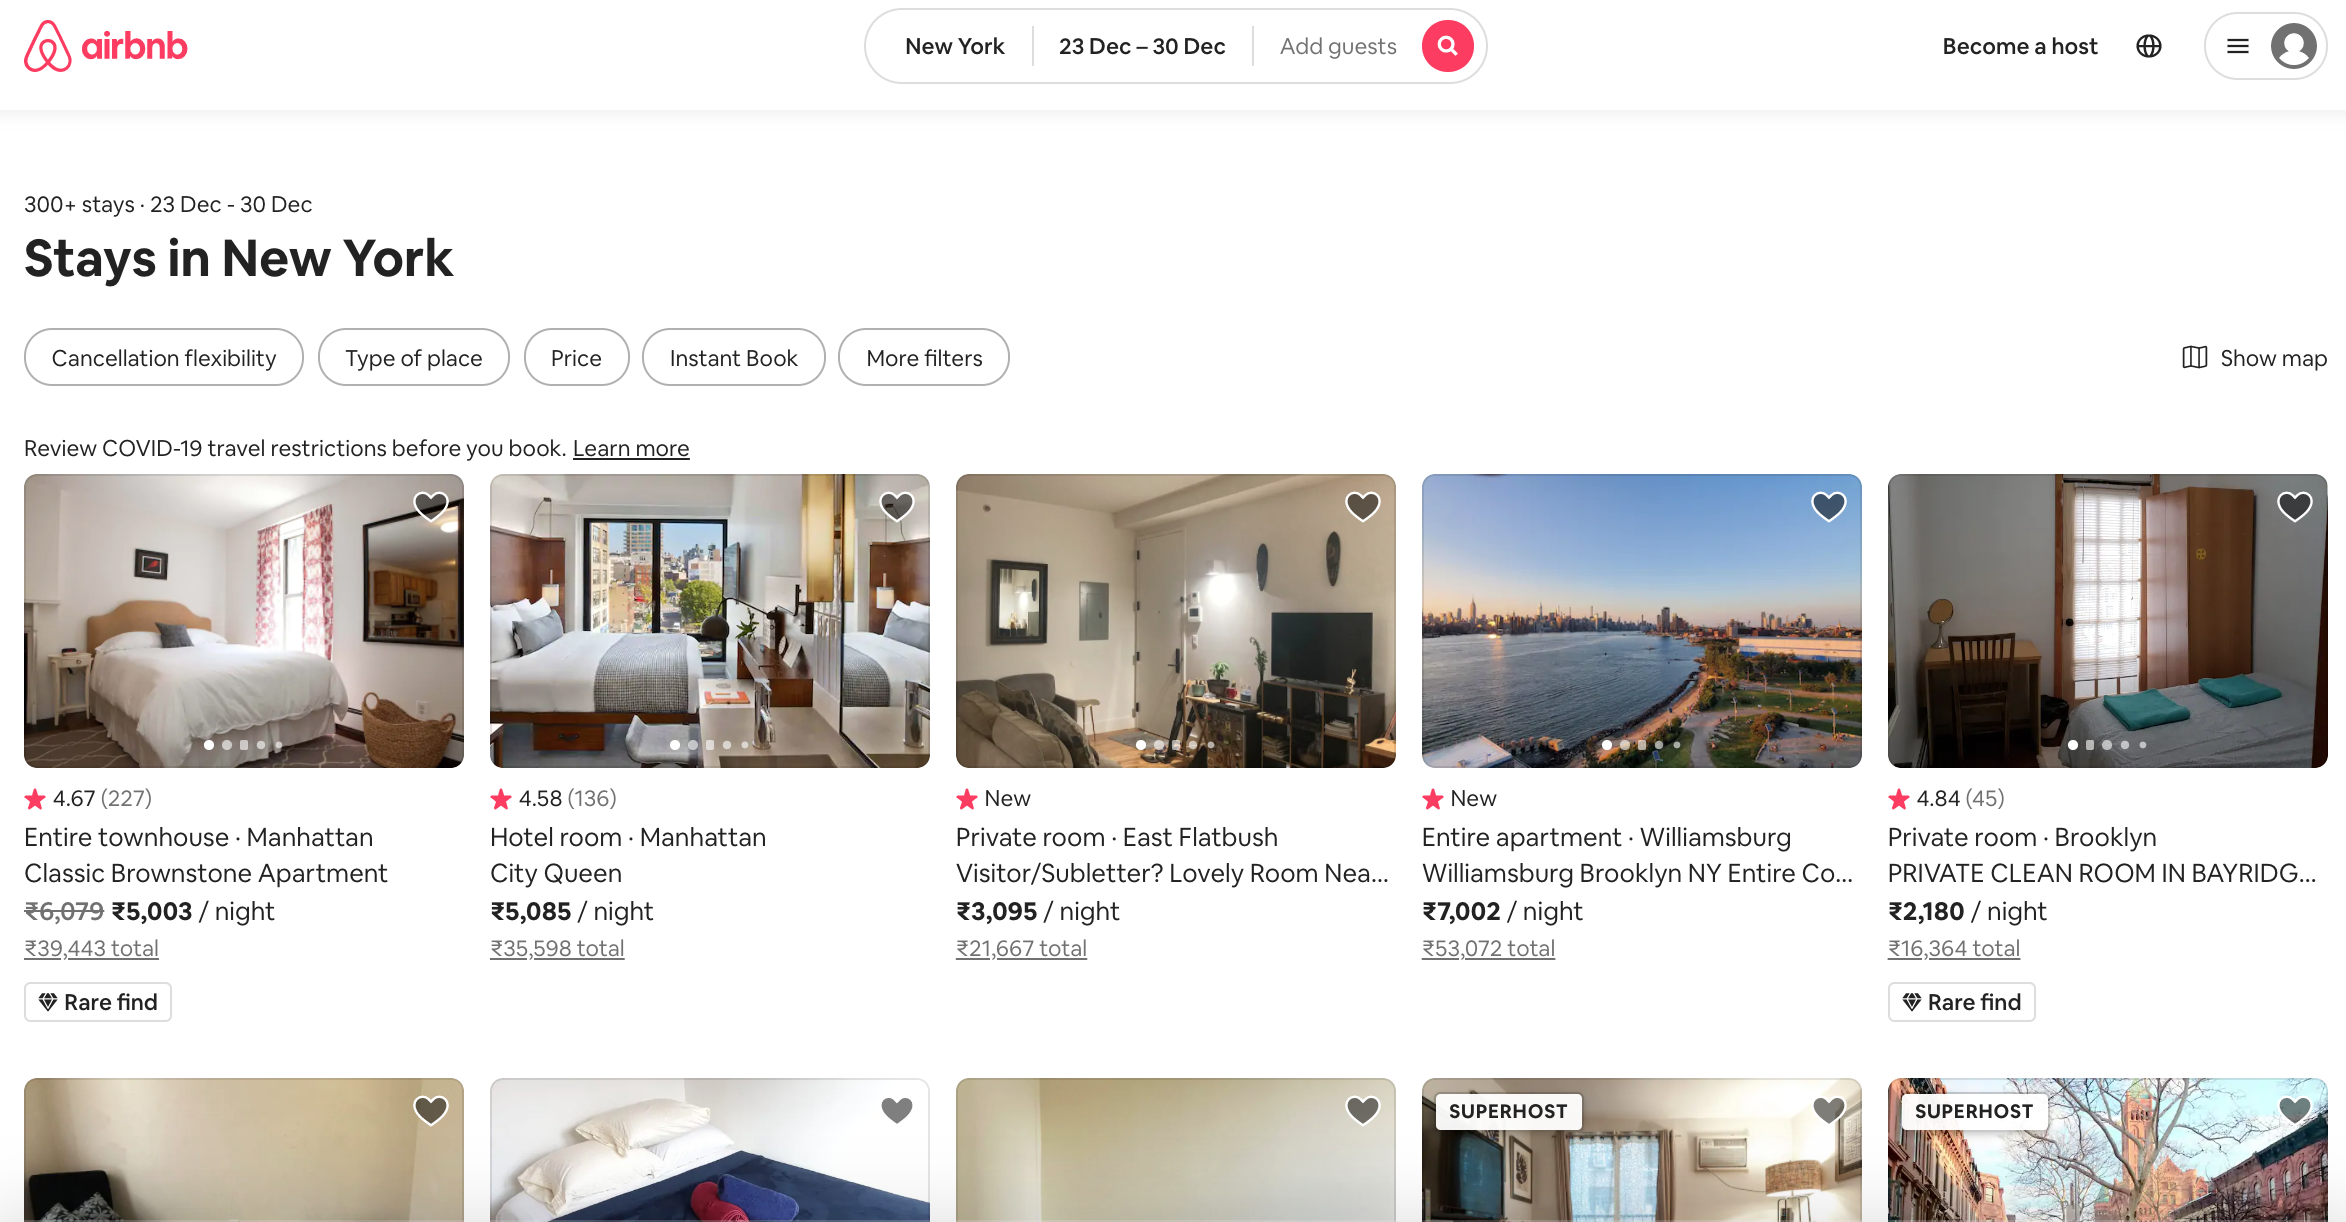
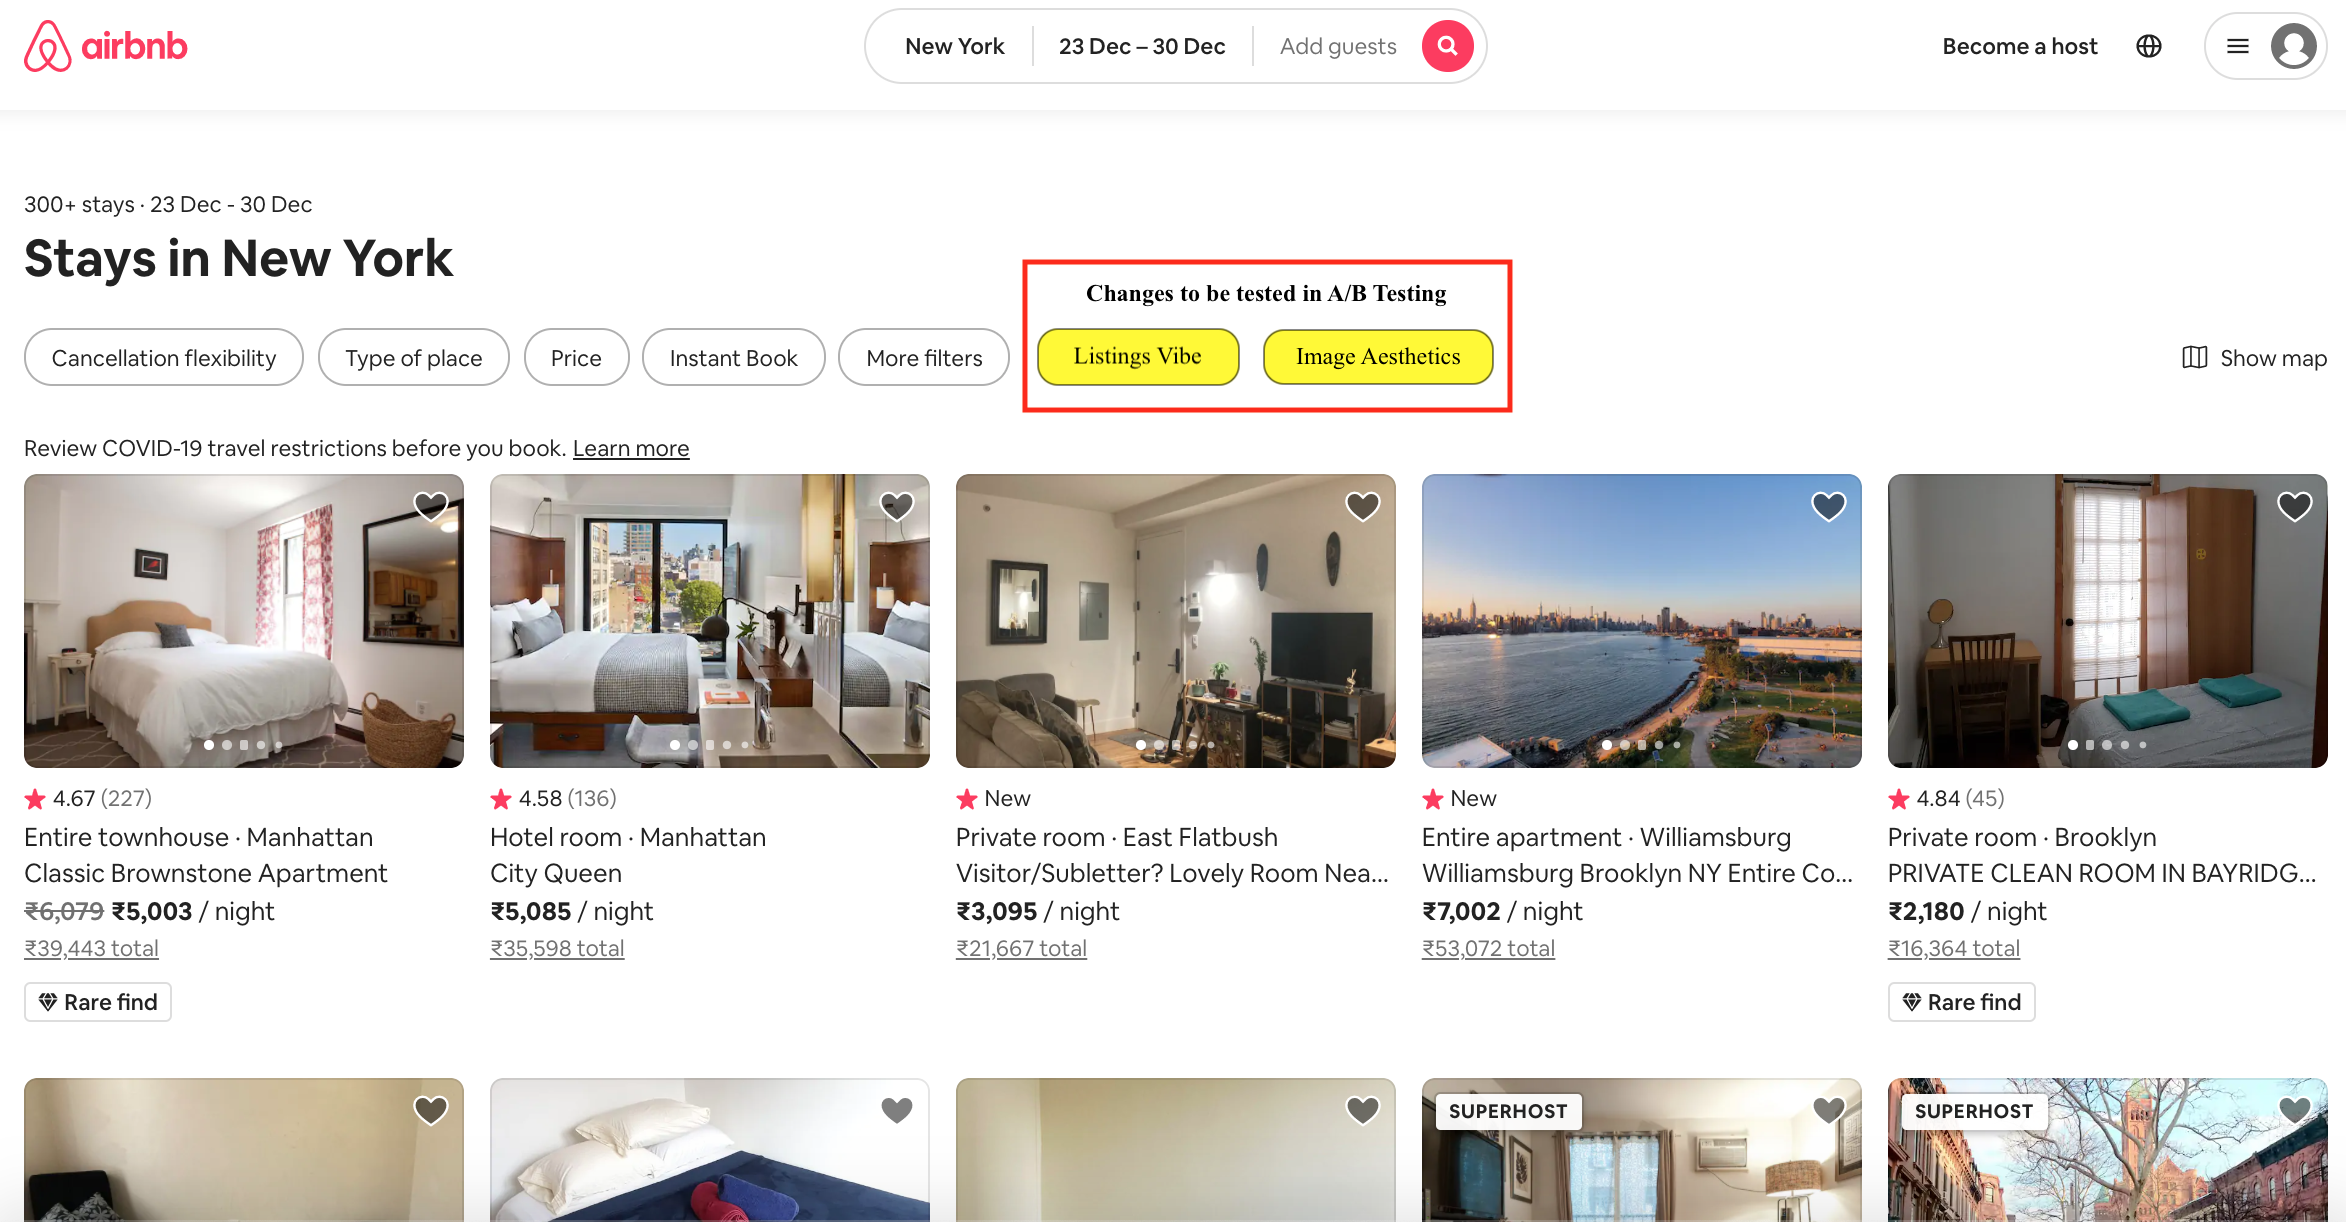
Users of online home listings portal such as Airbnb have to rely solely on information provided by hosts. It is vital that the images posted by the host is clear and an accurate depiction of reality. In this regard, it makes sense that users would want to prefer listings with very good image quality and aesthetics. Currently there is no easy way for users to search by image quality, in this project a deep learning model is used to assess the image posted by hosts. A image quality score is assigned to each image and the users can then sort the listings by this score such that the listings with the best image quality will appear at the top and making it easier for users to find what they are looking for.

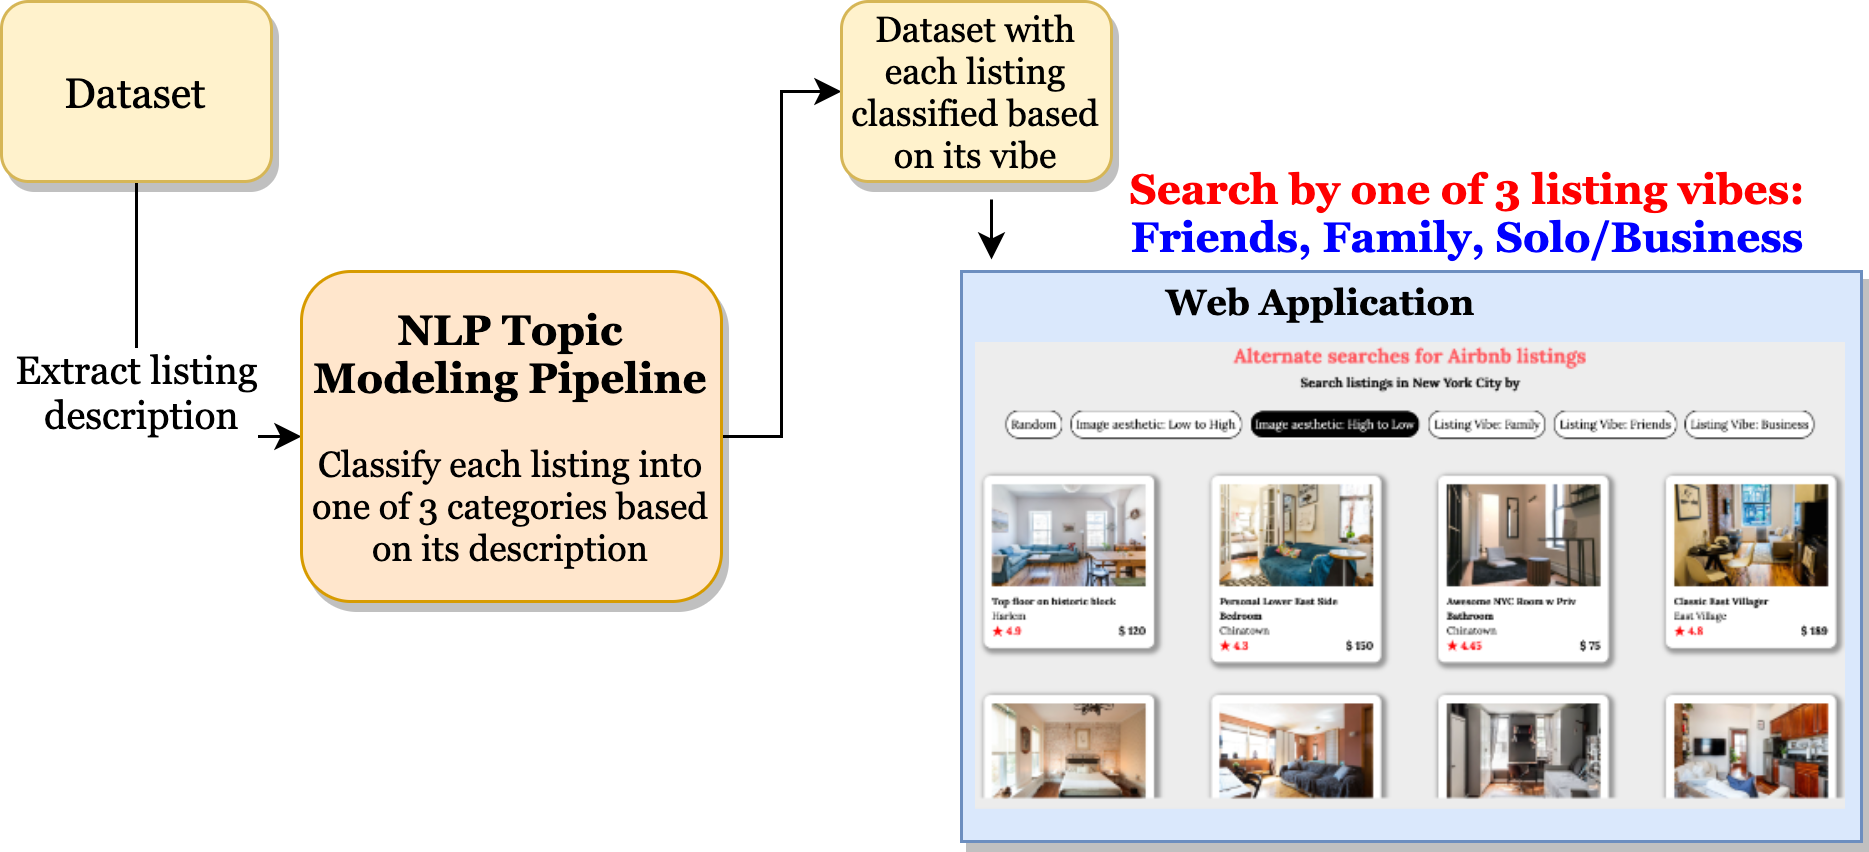
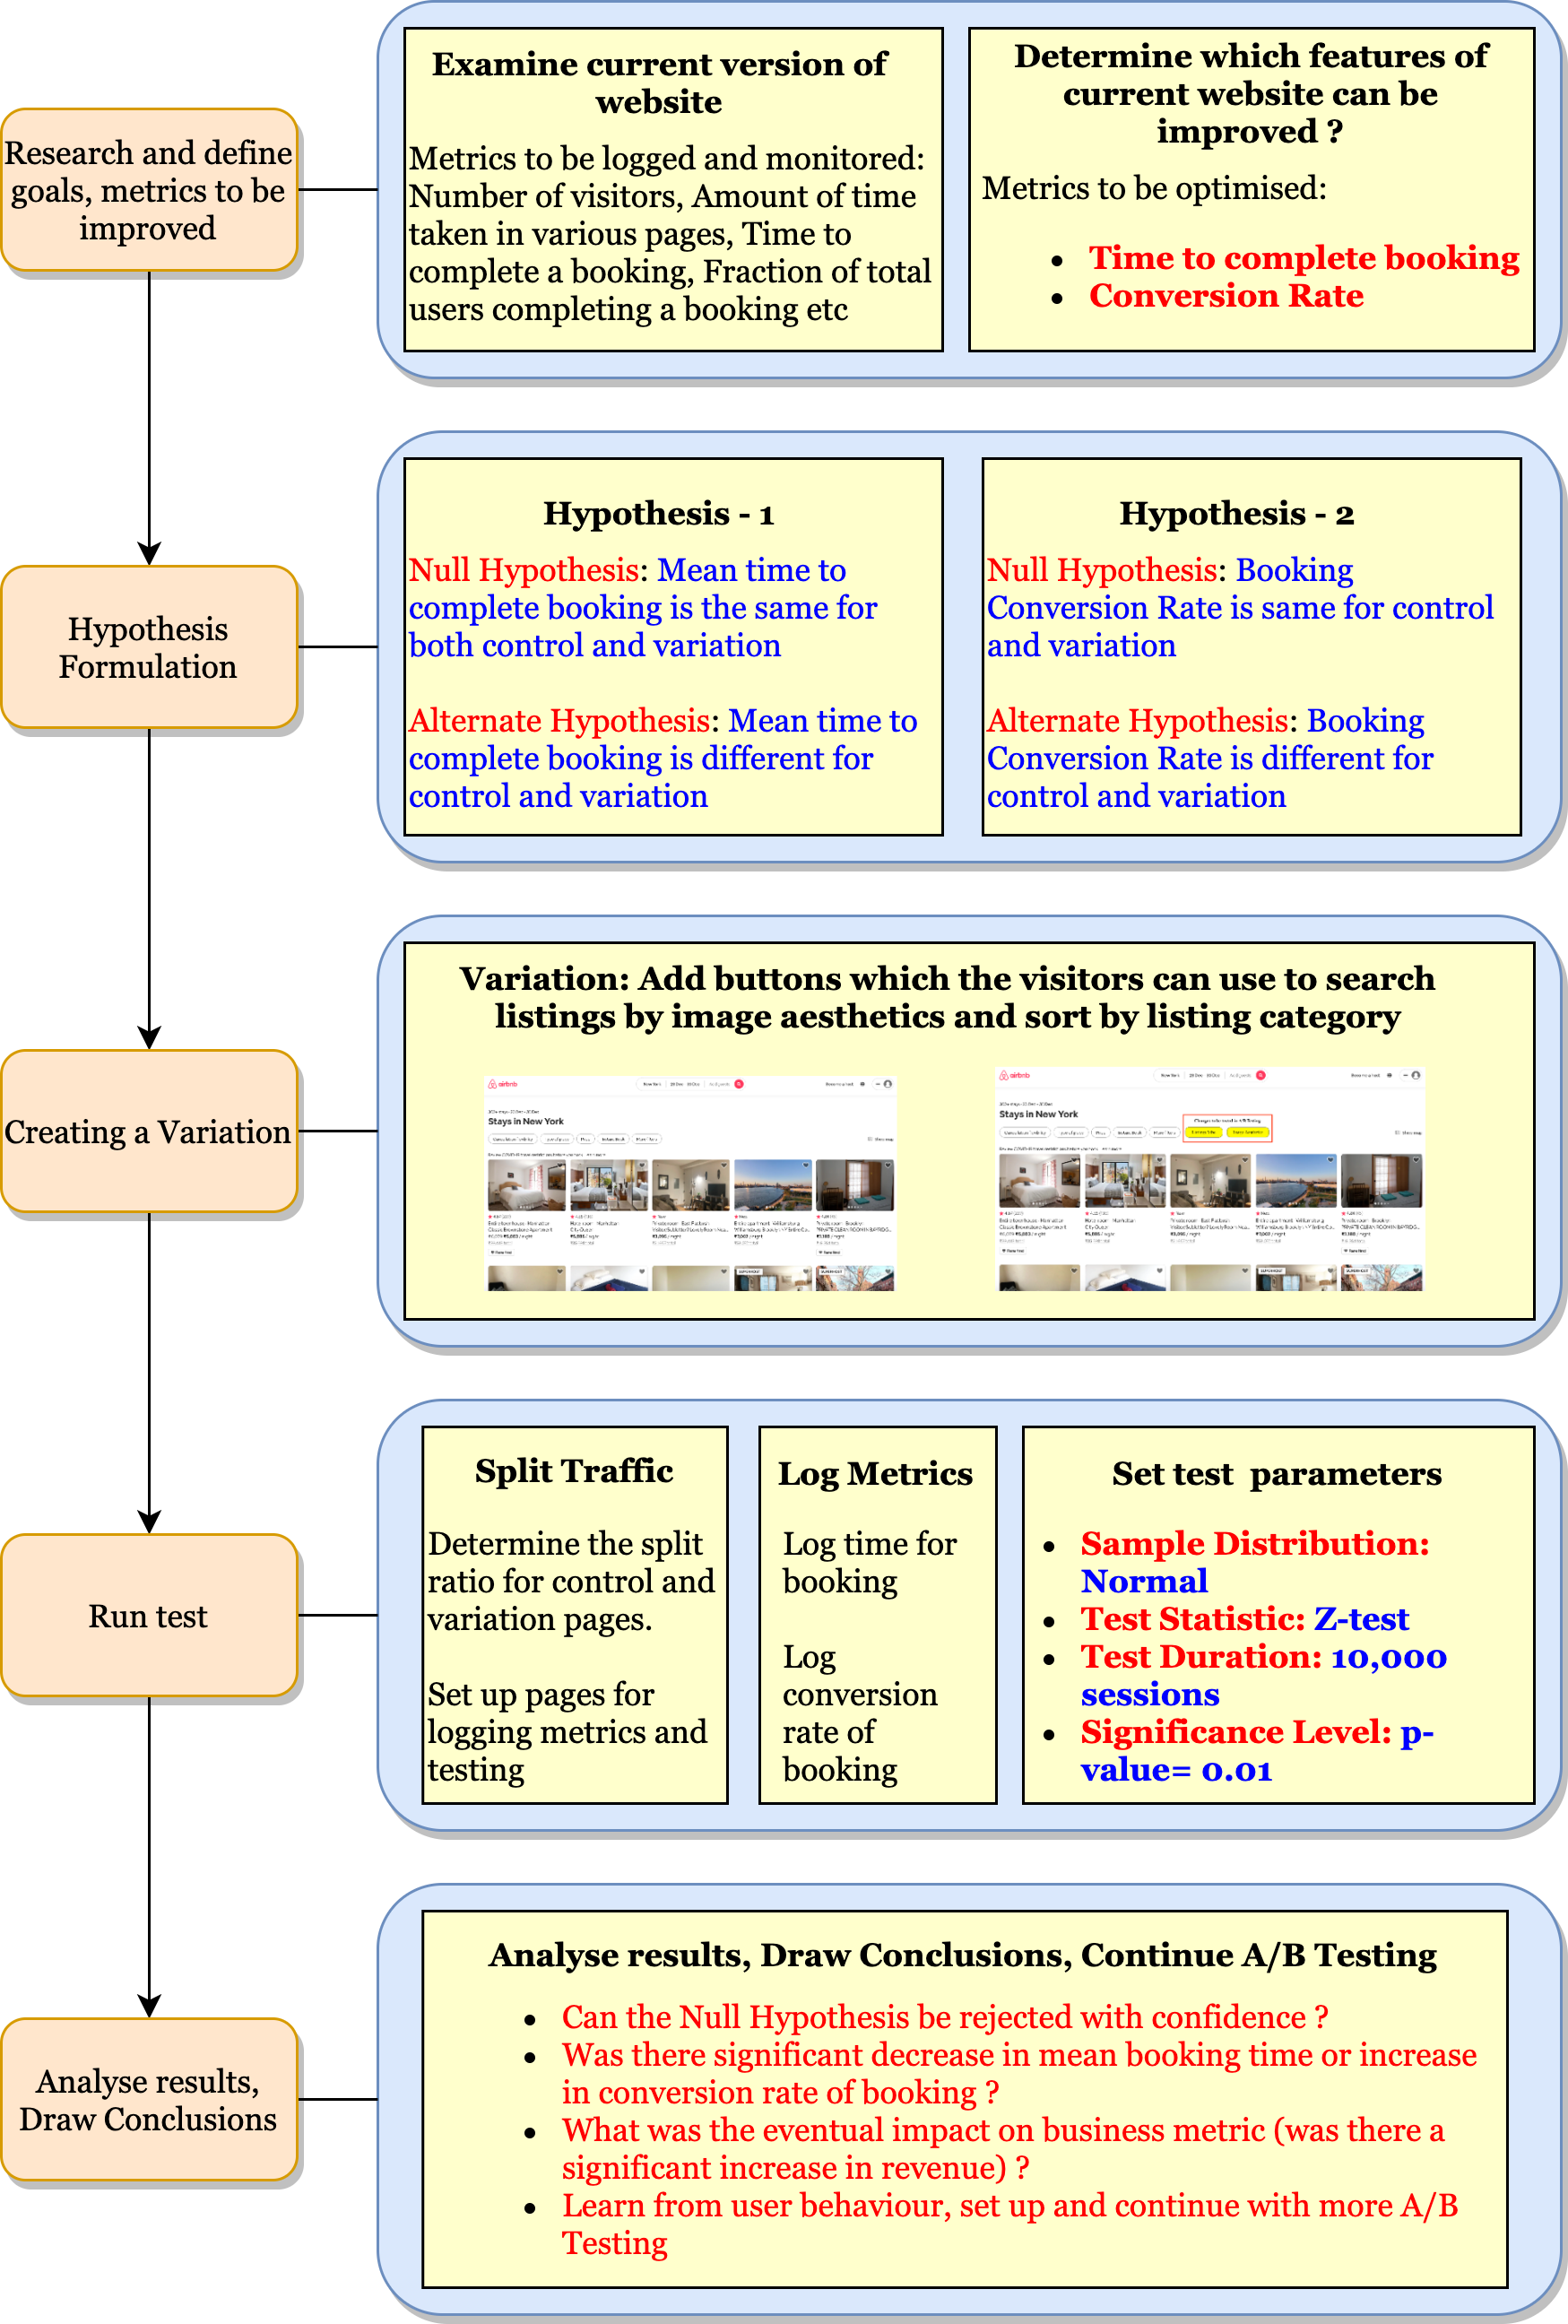
Pipeline: Search by Image Aesthetics

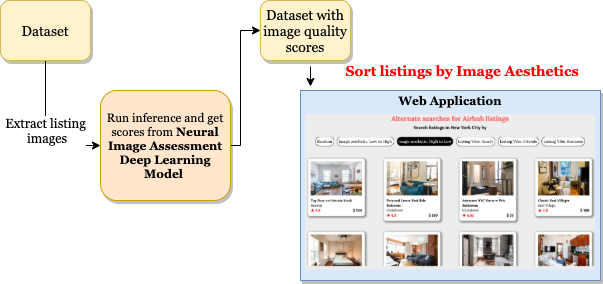
The Deep Learning Model used to assess image quality is Google's Neural image assessment model. It is based on Convolutional Neural Networks (CNN). This implementation of the model was used to assign scores to photos of listings.

Images with Best Aesthetics
Images with Poor Aesthetics

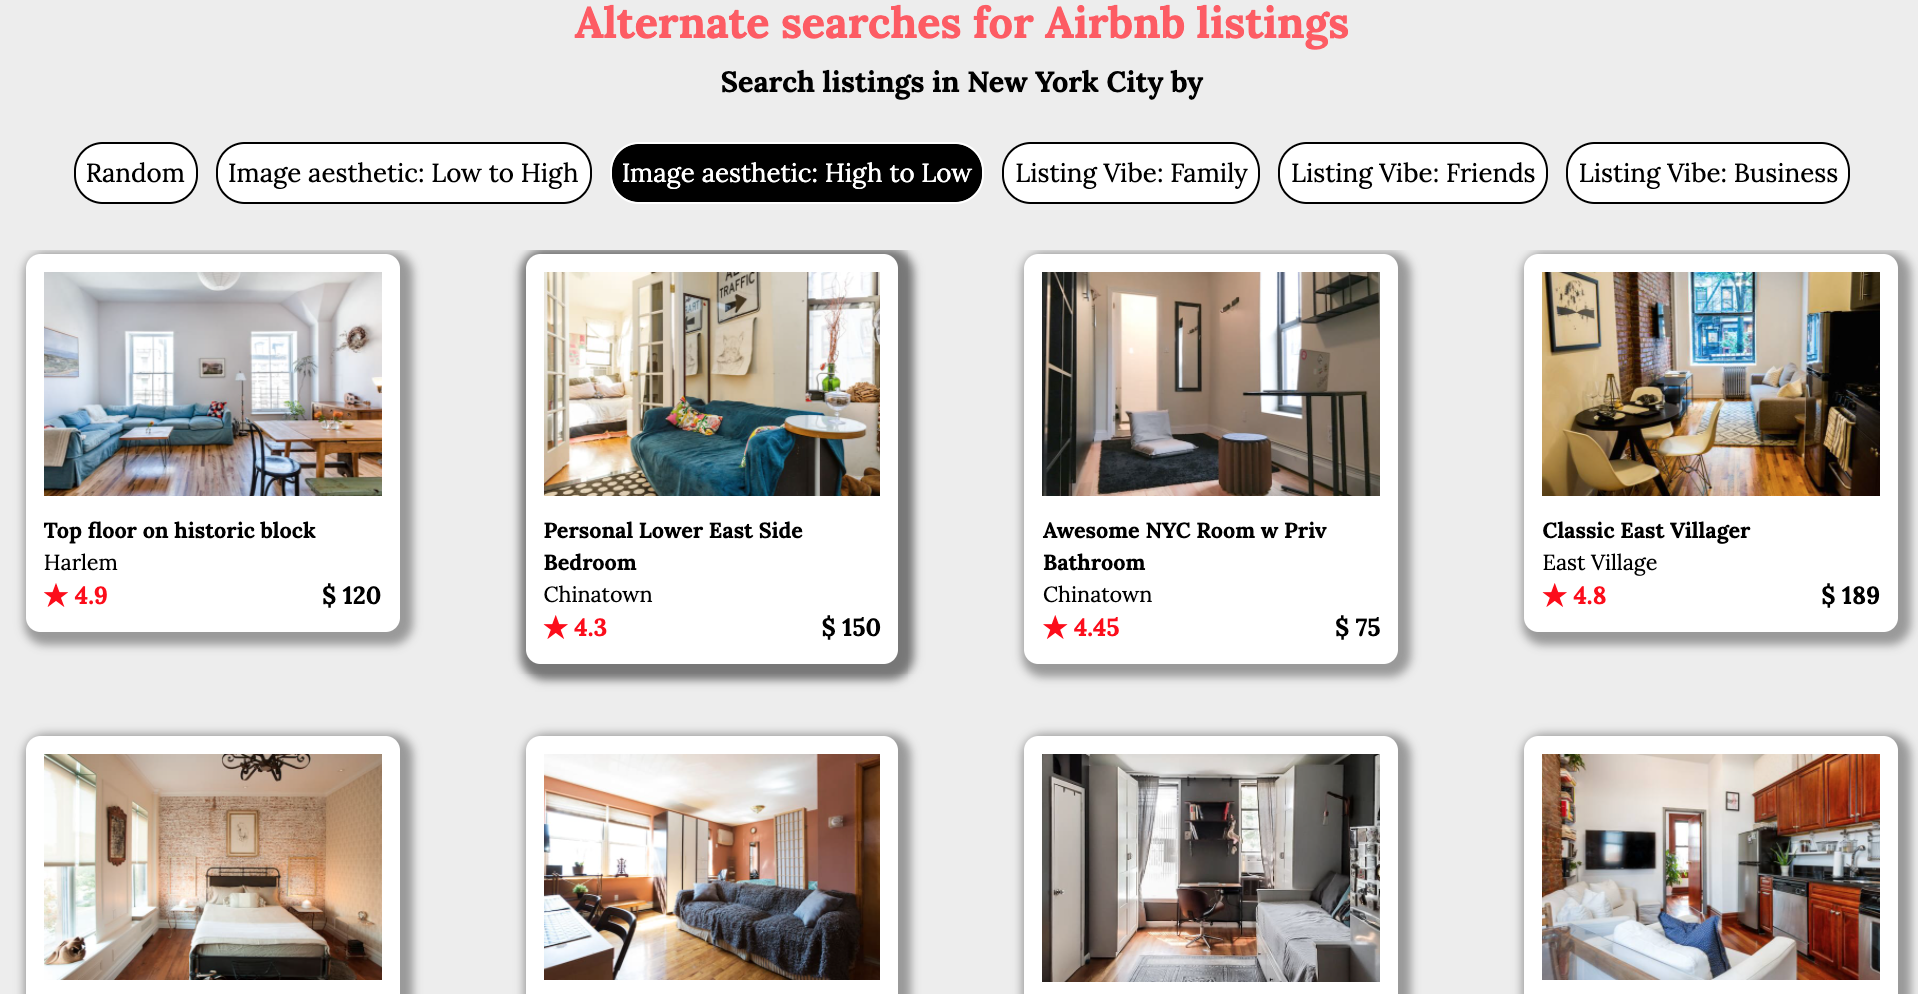
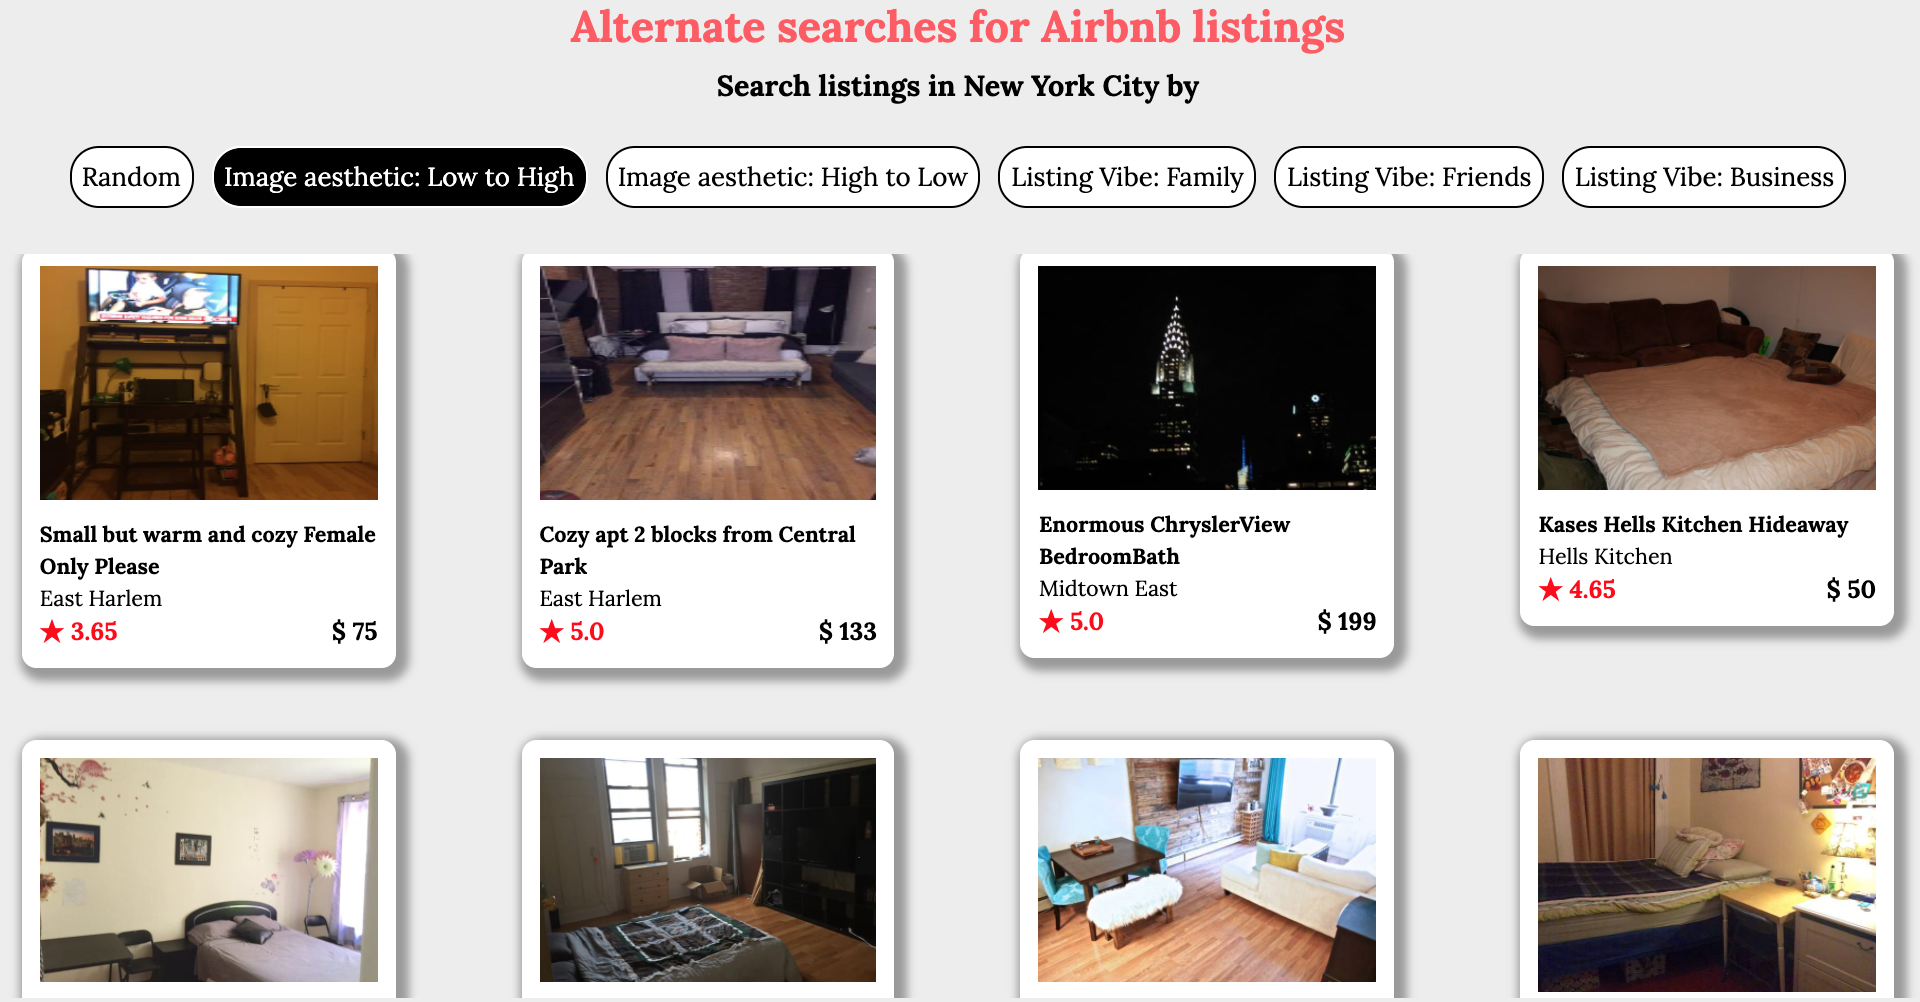
The results indicate how the Deep Learning model has accurately assigned high aesthetic scores to brightly lit images of rooms with clearly visible amenities. Whereas images shot in low light, with poor clarity are assigned lower scores. This feature would be very useful for users to eliminate such listings and encourage more hosts to upload pictures of better quality.

Classifying listings based on Topic Modeling of listing description

Why search by Listing Vibe ?

Airbnb lets users search for listings based on a number of criteria such as Location, Price, Room Type, Number of people accommodated. However one of the aspects missing in this is What type of guests are most welcome in the listing ? Generally Airbnb guests fall in one of the below categories,

  • Family: Guests looking for accommodation for family vacation. Such guests usually look for a place in good neighbourhood, which is safe for kids amongst other criteria.
  • Friends: When travelling with friends, some of the important criteria for booking a listing are Tolerance to loud talking, Permission for Parties, Close to restaurants, bars etc
  • Solo/Budget travel: Typically these guests search for Budget friendly options, even if the place is relatively small and does not include all the amenities.
  • Business Visit: Guests visiting for Business purposes typically look for a place in Good Neighbourhood, Close to Downtown for socialising with excellent amenities.

However the Airbnb webpage does not support searching listings based on the above characteristics. There is no way for users to search for listings with a particular theme like the ones listed above. One of the objectives of this project is to come up with an option for users to search based on Listing Vibe. The next few sections will describe how this is achieved.

Pipeline: Search by Listing vibe

The listing descriptions, neighbourhood descriptions for each listing are extracted from the dataset. This will then be fed to NLP Pipeline which converts words and sentences into a set of features. These features will then be used to perform Topic Modelling. This process will generate a set of topics (based on grouping words that have frequently occurred together). Every listing will then be assigned to one of the topics. Users can then filter the listings based on these specific categories.

NLP Pipeline for Topic Modelling

The NLP Pipeline involves converting a sentences into words and then ultimately into set of features which can then serve as input to Machine Learning Model. This process consists of the following steps,

  • Input: The listing and neighbourhood descriptions will together form Input Data
  • Tokenise Words: Converts sentences into list of words, removes punctuations.
  • Stop Words Removal: A lot of words which occur frequently in all the documents do not add much value in extracting useful features. As a result, such words are removed.
  • Bigrams Models: Identify words that commonly occur together with each other (Example: Art deco. In addition to individual words, these serve as additional features.
  • Lemmatization: Reducing various inflected forms of a word to the basic root word. For example, after this transformation the word located will be reduced to locate.
  • Term Document Frequency: Counts the number of occurrences of each word in every document.
  • Topic Modelling using Latent Dirichet Allocation (LDA) Model: The corpus of Id to Word Mapping, number of occurrences of various words in each of the documents will serve as inputs to the LDA Model which will then generate a predefined number of distinct topics based on grouping of similar words which would have occurred together across different documents.

Topic Modelling: Identifying and Labelling Topics

The LDA Model will return the predefined Number of Topics set of closely related words. After processing the Airbnb Listings and Neighbourhood description through the above pipeline, the following set of words were returned,

[(0, '0.036*"walk" + 0.031*"restaurant" + 0.027*"block" + 0.025*"place" + ' '0.025*"train" + 0.024*"away" + 0.024*"subway" + 0.022*"minute" + ' '0.021*"close" + 0.019*"good"'), (1, '0.021*"guest" + 0.020*"stay" + 0.015*"space" + 0.015*"share" + ' '0.014*"available" + 0.014*"home" + 0.012*"use" + 0.012*"private" + ' '0.012*"access" + 0.011*"need"'), (2, '0.028*"full" + 0.022*"large" + 0.018*"size" + 0.014*"tv" + 0.014*"private" ' '+ 0.013*"include" + 0.013*"fully" + 0.011*"space" + 0.011*"building" + ' '0.011*"high"')]

It is now up to the ML practitioner to assign individual labels to each set of these words. Since the objective in this project is to assign Listing Vibe, the following figure shows the topics that were assigned based on the words present in each group.

The above figure also shows an example listing description for each of the three topics that were assigned. It is interesting to note that the LDA Model did return 3 sets of words which roughly correspond to the three types of listings that were mentioned earlier: Family/Kids, Friends, Solo, Business Visits.

Topic Modeling: Visualisation

The following screen capture shows the visualisation of the 3 topics. This was done using the library. Each circle corresponds to a topic. The three big circles in different quadrants indicate that the topics identified are specific and distinct. Hovering on each topic (circle) will show the most dominant words present in that topic.

Screenshot: Search by Listing Vibe

The following screen capture of the Webapp illustrates how search by Listing Vibe works. Users can now filter listings based on the Topic assigned to each listing. This should hopefully add a new dimension to searching for accommodation, make it easier to find the type of listings user is looking for, thereby reduce the booking time and improve the conversion rate.

How to study the effectiveness of newly added search features ? - A/B Testing

A/B Testing: What is it and its purpose ?

So far this project introduced two alternate ways of searching for listings on Airbnb namely,

  • Sort listings by Image Aesthetics
  • Search by Listing Vibe
The next obvious question is how can we test the effectiveness of these newly introduced features ? The answer to this is through a process called A/B Testing, which can be used to compare the existing version of the website against the version with the newly introduced changes. The methodology used is described in the following section.

A/B Testing Methodology: How to do it ?

The A/B Testing methodology consists of following steps, each of which are described in detail in the following sections.

  • Research, Define Goals and Set up Metrics
  • Hypothesis Formulation
  • Create Variation
  • Run A/B (Split) Testing
  • Collecting Data and Statistical Analysis
  • Analyse Results and Draw Conclusions
Step 1: Research, Define Goals and Set up Metrics

The first step before getting started on A/B Testing is to do prior research. To study how the current website works, inspect how effective the current features are. To serve this purpose, a number of metrics should be logged and monitored: Number of site visitors, Amount of time taken in various pages, Time to Booking, Conversion Rate (Fraction of total users completing a booking).

The above analysis and the metrics collected will help in understanding which parts of the website can be improved in order to increase sales or engagement. Based on this, a few specific metrics can be chosen to be improved through A/B Testing. For this project, the following metrics were chosen to be optimised,

  • Time to complete booking
  • Conversion Rate

Step 2: Hypothesis Formulation

The next step is to formulate hypothesis. For every metric we want to improve on, a Null and an Alternate Hypothesis need to be introduced. The Null Hypothesis indicates that the newly introduced feature did not make any change compared to the existing version whereas the Alternate Hypothesis suggests that there was a change in metrics (may be better or worse) due to the newly introduced feature. For the two metrics chosen in this project, following are the Null Hypothesis and Alternate Hypothesis.

  • Hypothesis 1: Time to complete booking
    • Null Hypothesis: Mean time to complete booking is the same for both control and variation
    • Alternate Hypothesis: Mean time to complete booking is different for control and variation
  • Hypothesis 2: Conversion Rate
    • Null Hypothesis: Booking Conversion Rate is same for control and variation
    • Alternate Hypothesis: Booking Conversion Rate is different for control and variation

The goal of A/B Testing is to conclude based on statistical analysis, if the newly introduced feature resulted in any change to the defined metric. In case, there is a significant change, then the Null Hypothesis can be rejected. Further if the change is an improvement in metric then the newly introduced feature can be deployed permanently as part of the website. If the change resulted in worse metrics, then the new feature can be discarded. This way A/B Testing provides a quantitative approach to measure the effectiveness of any new feature.

Step 3: Create Variation

Once the goals, metrics are defined and hypothesis formulated, the next step is to add the new feature which needs to be tested. This version of the webpage is referred to as the Variation and the existing version is referred to as the Control. The following figure shows one possible option for Control and the Variation versions of the webpage for this project.

Control (Existing version)
Variation (Version with new features)
Step 4: Run A/B (Split) Testing

After the Control and Variation versions of the webpage are setup, the next step is to run the split tests. For this purpose, the visitors to the webpage will be split and redirected to the two different versions. This means that a portion of the visitors will see the Control version whereas the rest will see the Variation version. The following test parameters will need to be defined before running the tests,

Parameter Value Description
Split Ratio 0.5 The ratio of the visitors who will see the Control and Variation versions.
Test Duration 10,000 sessions The duration to which the test needs to be run. This is a trade-off between two factors. The test needs to be run long enough to establish statistical significance and draw any meaningful conclusions. At the same time, if the new feature (variation) results in degradation of sales or engagement then it is important to make sure that test is not run for too long in order to minimise loss in revenue.
Sample Distribution Normal The distribution of values for metrics need to be assumed in order to use a suitable Test statistic. For example, the values for metric Booking Time can be assumed to be Gaussian.
Test Statistic Z-test A Z-test is any statistical test for which the distribution of the test statistic under the Null hypothesis can be approximated by a normal distribution. It measures how far the test statistic is from the mean of the normal distribution under Null Hypothesis. Higher the value, less likely it is for the test statistic to be under Null Hypothesis, making it possible to reject Null Hypothesis with greater confidence.
Significance Level (p-value) 0.01 A p-value is a measure of the probability that an observed difference could have occurred just by random chance. The lower the p-value, the greater the statistical significance of the observed difference.

The following animation illustrates how the Z-test statistic and p-value varies for different distributions of Variation as compared to the Control.

Step 5: Collecting Data and Statistical Analysis

For the purpose of this project, sample simulated data will be used in order to perform statistical analysis of A/B Testing. The values for the two pre-defined project metrics are as shown in the following table.

Version No. of Sessions Average Booking Time (Time) Standard Deviation (Time) Conversion Rate
Control 10,000 300 seconds 85 seconds 1.50 %
Variation 10,000 296 seconds 93 seconds 2.00 %

The following code snippets show how the test statistics can be obtained for simulated data presented in the table above.

The following figures show the distribution of test statistics, Z-test score for Booking Time Hypothesis, Distance for Conversion Rate Hypothesis and the corresponding p-values.

Hypothesis 1: Time For Booking
Hypothesis 2: Conversion Rate
Step 6: Analyse Results and Draw Conclusions

The final step in A/B Testing is to analyse the results of statistical analysis and based on that to draw conclusions.

  • Can the Null Hypothesis be rejected with confidence ?
    • Hypothesis 1: Booking Time - Was there significant decrease in mean booking time ? The Z-test score is 2.51 which corresponds to p-value of 0.0061 which is lower than the pre-defined Significance level = 0.01. So we can conclude that Null Hypothesis can be rejected and that the Mean Booking Time reduced by 4seconds in the Variation as compared to the Control version of the webpage.
    • Hypothesis 2: Conversion Rate - Was there significant increase in Conversion Rate ? The Distance metric is 2.87 which corresponds to p-value of 0.089 which is higher than the pre-defined Significance level = 0.01. So we cannot reject the Null Hypothesis and hence we cannot conclude that there is any significant improvement in Conversion Rate in the Variation as compared to the Control version of the webpage.
  • What was the eventual impact on business metric (was there a significant increase in revenue) ? If the test is done methodologically, the result should be evident at the end of A/B Testing. However at times, it is possible that although the new feature improved the business metric over short-term, the same might not be true over long term. Hence it is important to constantly monitor the metrics, set up continuous testing and keep learning from changing customer behaviour.
  • Learn from user behaviour, set up and continue with more A/B Testing: One of the additional benefits of A/B Testing is that at times, there will be unexpected and surprising results or insights that will be observed which are not related to the Metric trying to be optimised. So even if the new feature does not add significant improvements in sales or engagement, a number of other insights can be used to set up further tests in the future.

Deployment, Serving and Production: CI/CD Pipeline

A FLASK Webapp was developed in order to demonstrate the Search by Image Aesthetics and Listing Vibe features. Using this, the users can sort the listings based on Image Aesthetics and also filter listings based on Listing Vibe. The webapp was containerised using Docker and was deployed on AWS Cloud. A CI/CD Pipeline was setup in order to facilitate continuous integration and deployment. The following block diagram shows all the components in the entire pipeline. The Deployed Webapp can be accessed here.

The production pipeline consists of the following components,

  • FLASK Webapp: Webapp and REST API to serve Model Predictions
  • Docker: Containerised FLASK Webapp which can then be deployed in any environment
  • AWS: CI/CD Pipeline
    • ECR Repository: The Docker Image is stored in this repository. Any changes to this image will trigger changes in the rest of the pipeline and the updates to the image will then be deployed to the Web Application.
    • CodeCommit : The pipeline is configured to use a source location where the following two files are stored,
      • Amazon ECS Task Definition file: The task definition file lists Docker image name, container name, Amazon ECS service name, and load balancer configuration.
      • CodeDeploy AppSpec file: This specifies the name of the Amazon ECS task definition file, the name of the updated application's container, and the container port where CodeDeploy reroutes production traffic.
    • CodeDeploy: Used during deployment to reference the correct deployment group, target groups, listeners and traffic rerouting behaviour. CodeDeploy uses a listener to reroute traffic to the port of the updated container specified in the AppSpec file
      • ECS Cluster: Cluster where CodeDeploy routes traffic during deployment
      • Load Balancer: The load balancer uses a VPC with two public subnets in different Availability Zones.

Resources