| T20 Batsmen types | ||
|---|---|---|
| Batsman type | Features | IPL 2018 Examples |
| Ideal | Batsmen with both phenomenal average and very high strike-rates. Every team's dream player, ideally a team expects one of its batsmen to be in this category. | Pant, Rahul, Ab de Villiers |
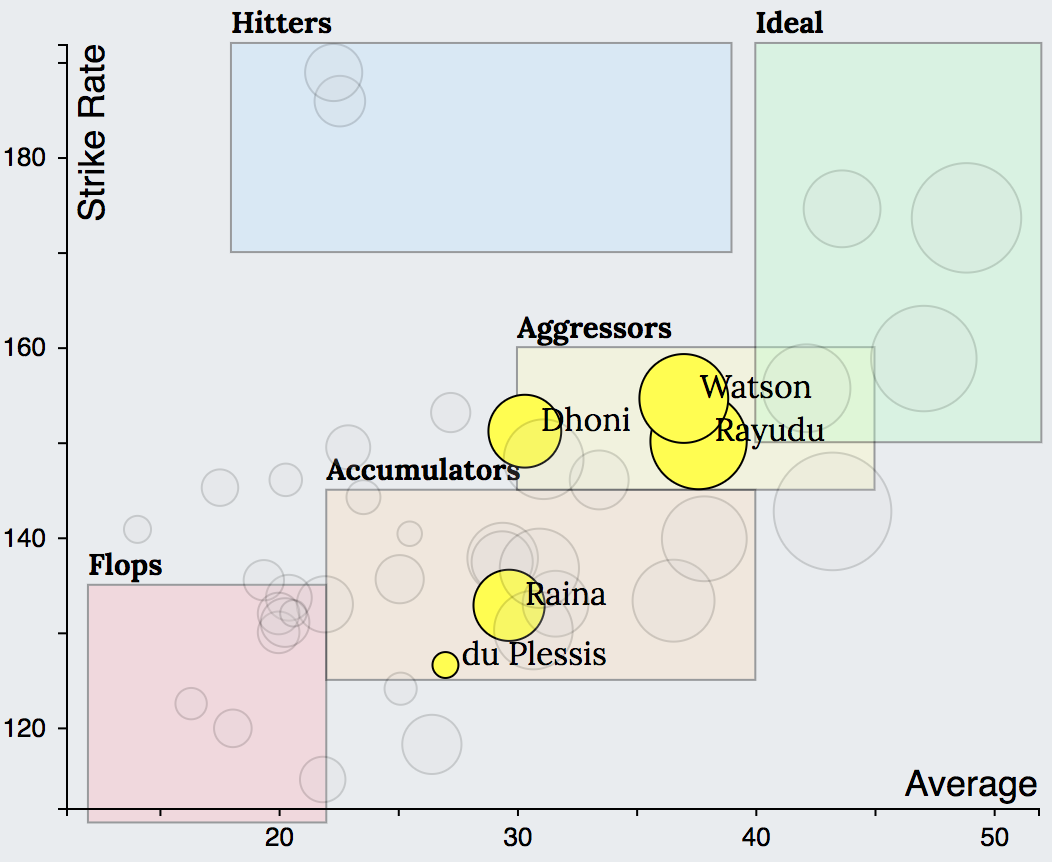
| Aggressors | Batsmen with good averages and good strike-rates. Batsmen who can adapt based on the game situation and perform consistently under pressure. | Dhoni, Watson, Rayudu |
| Accumulators | Batsmen with good averages but relatively low strike-rates. Especially suited for conditions not ideal for batting typically with average scores around 150 mark. | Kohli, Suryakumar Yadav, Dhawan |
| Hitters | Batsmen who may not score lots of runs but get runs at very high strike-rate. Vital when the innings requires some impetus or when the required rate is climbing sharply. | Narine, Russell |
| Flops | Batsmen who score very few runs at low strike-rates. Although no one wants to be in this category, it is inevitable that every team will have batsmen going through poor form. | Pandey, Shakib, Rohit |
| T20 Bowlers types | ||
|---|---|---|
| Bowler type | Features | IPL 2018 Examples |
| Ideal | Bowlers with many wickets at very low economy rates. They are every captain's dream, although it is unrealistic to expect such performances during every season. | Rashid, Bumrah |
| Containers | Bowlers who may not get lot of wickets but operate at low economy rate. Perfect for bowling in the powerplay and in high scoring games. | Bhuvaneshwar, Ashwin |
| Average | Bowlers who pick up fair number of wickets at reasonable economy rates. These are the bowlers a captain can bank on and expect them to be consistent and not concede too many runs. | Kuldeep, Kaul |
| Strikers | Bowlers who pick lot of wickets but at high economy rates. Perfect when the captain needs break-throughs in the powerplay and middle overs. | Tye, Hardik, Umesh Yadav |
| Flops | Bowlers who concede lot of runs with very few wickets to show for. Critical to have backups when one of the frontline bowlers end up in this category. | Bravo, Unadkat, Mohit |
Given these categories of players, how do we go about picking our batting and bowling line ups. Given a chance, all teams would want to have a line up filled up with Ideals and no Flops. While it is likely that any player could hit purple patch and end up being Ideal, it is not something we can count on. Instead we would like to find the optimum numbers of Accumulators, Aggressors and Hitters required in a batting line up. This is a tricky question because too many Accumulators in the top order often results in sub 200 score even with good starts whereas a team filled with Strikers will invariably have scores either around the 200 mark or have batting collapses with scores around the 140 runs mark. Similarly for bowling, the question is how many of each kind of these bowlers does a team need in order to increase its chances of winning ?
In order to answer this, we begin by looking at the batting and bowling charts of few of the T20 league champions for the 2018 season. This should provide some insights to determine the winning combination.
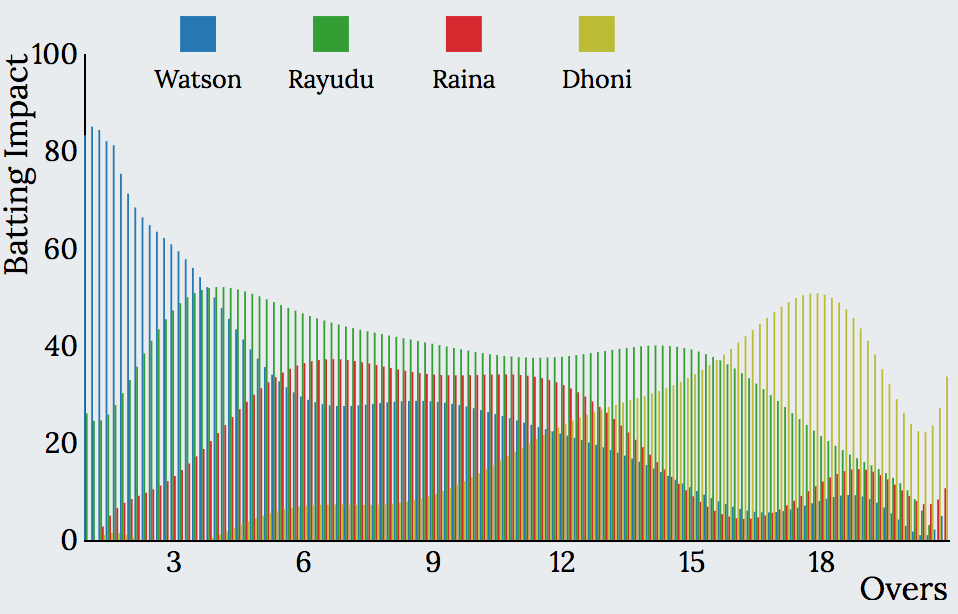
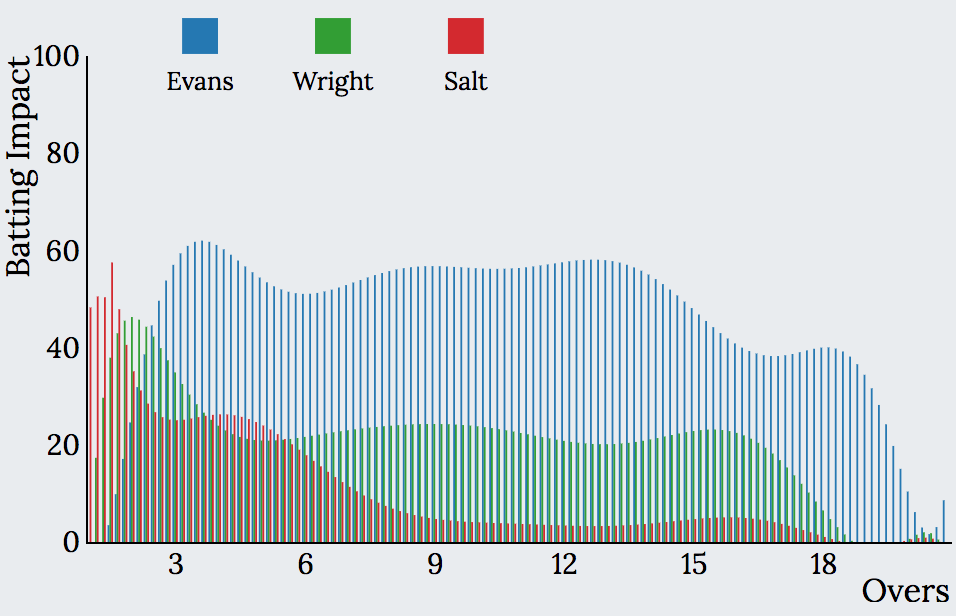
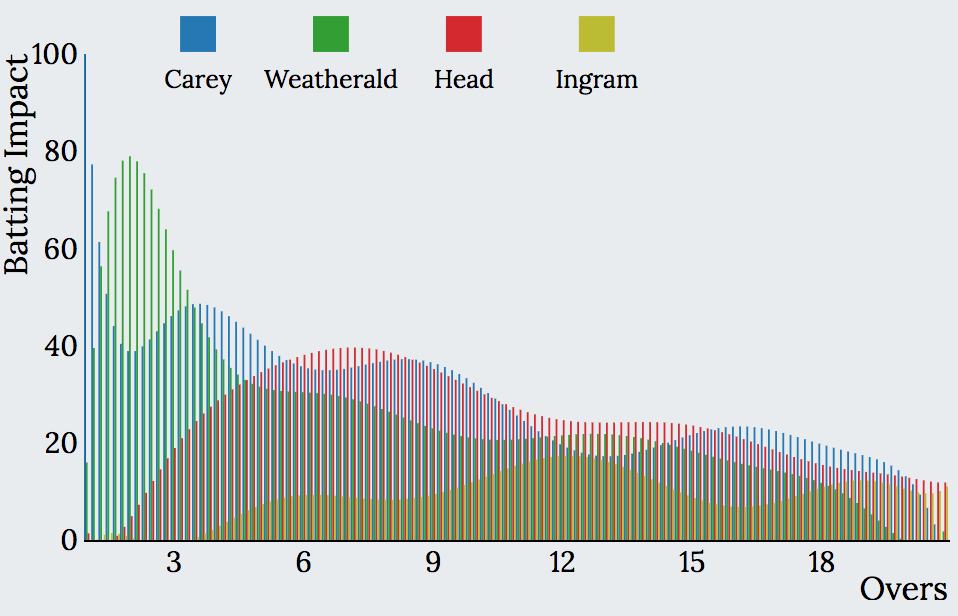
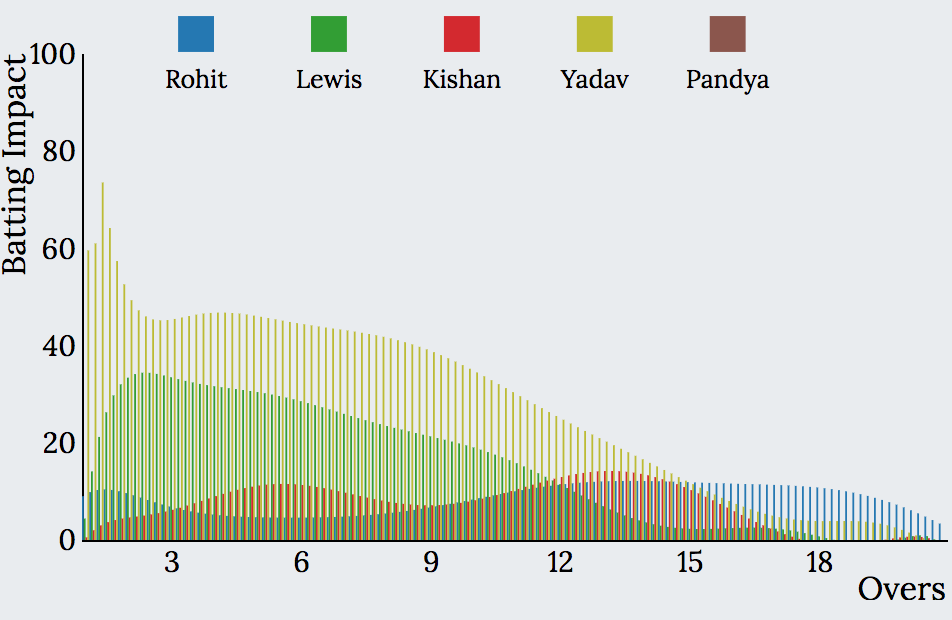
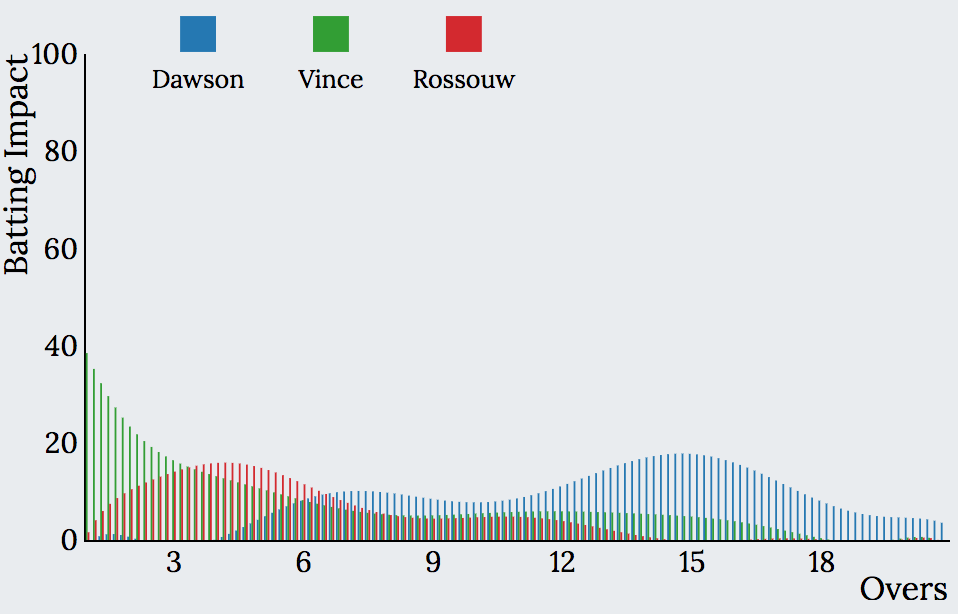
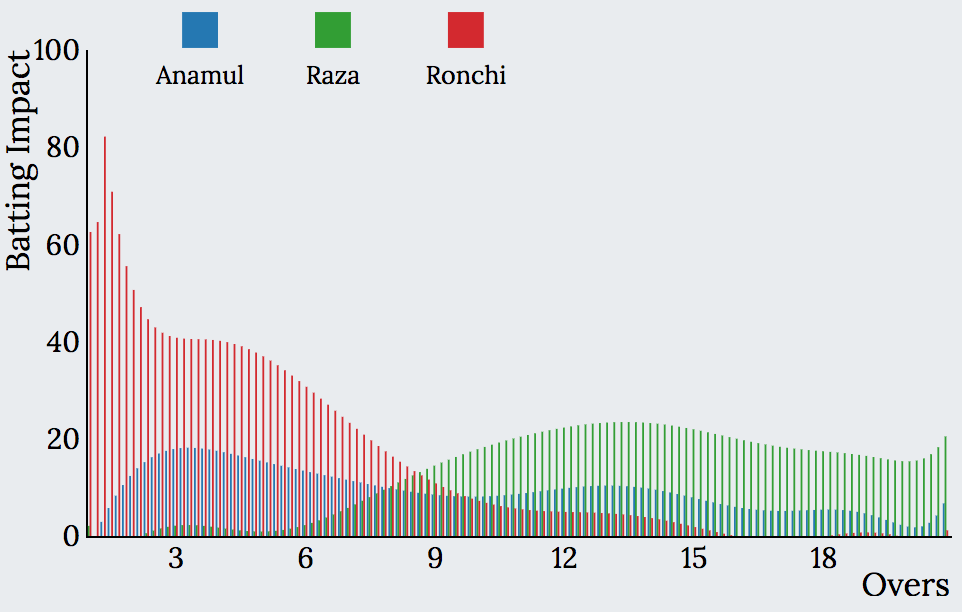
Batting charts of top ranked teams
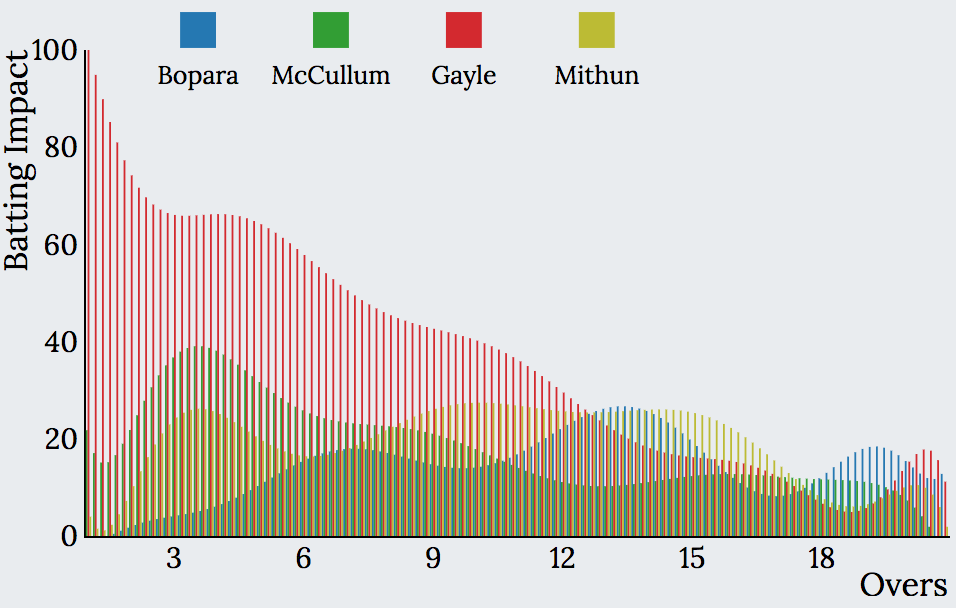
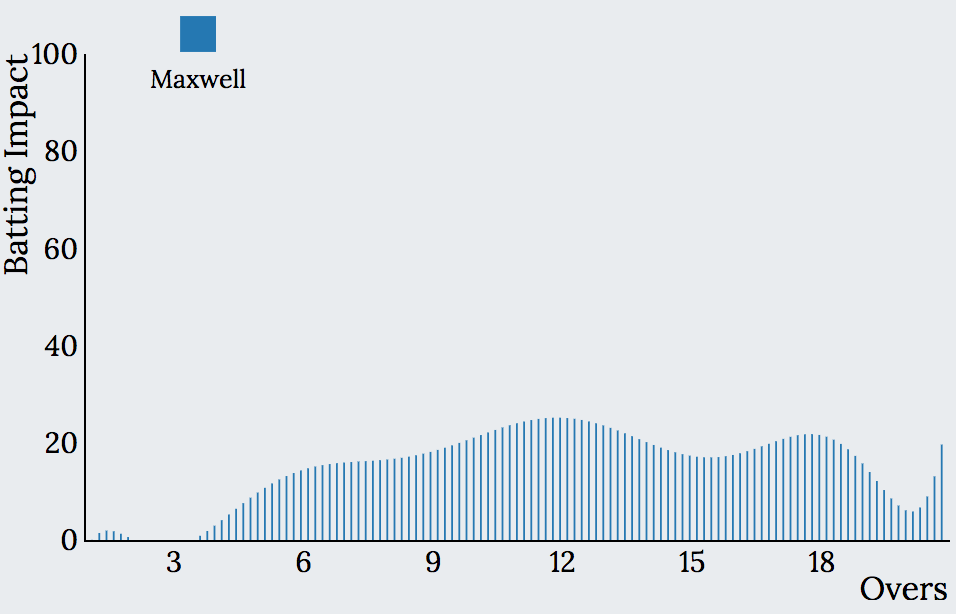
Batting charts of bottom ranked teams
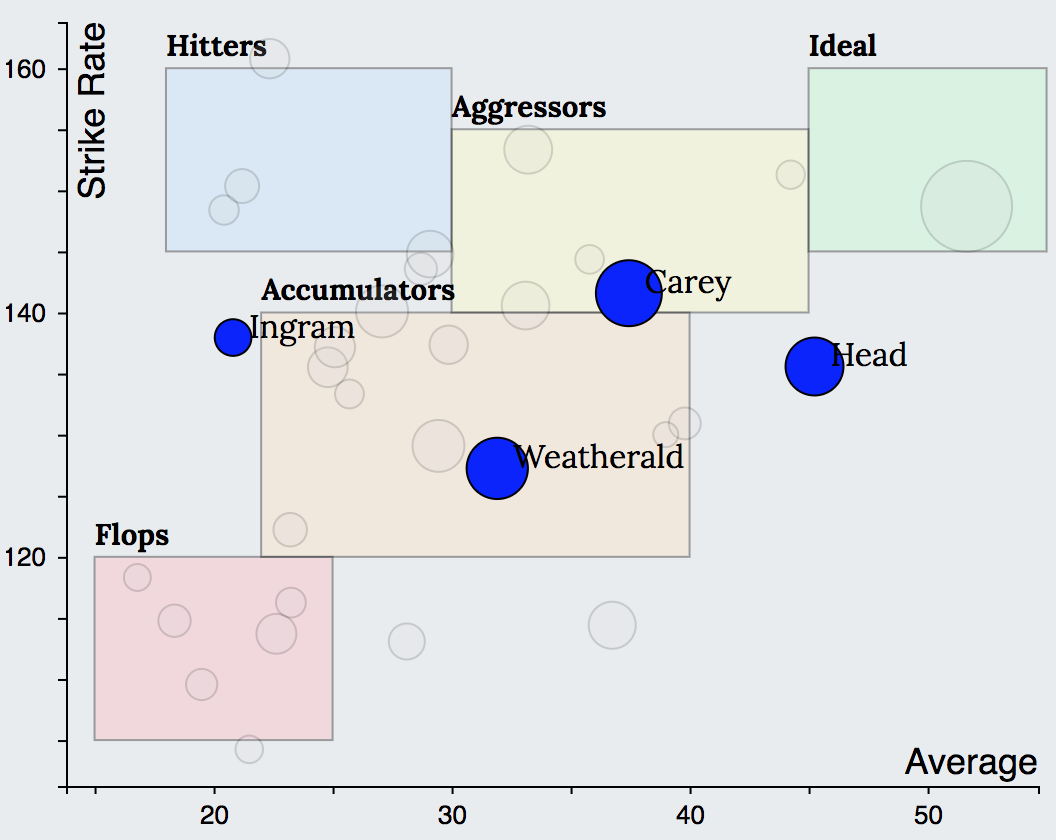
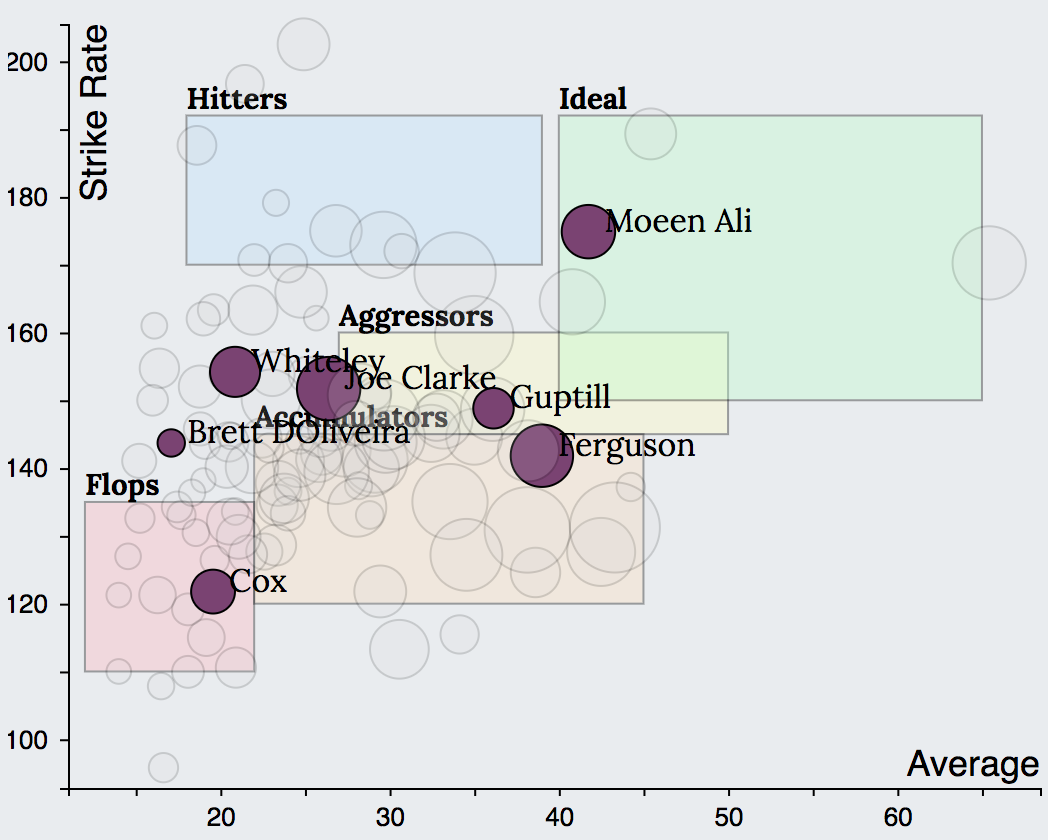
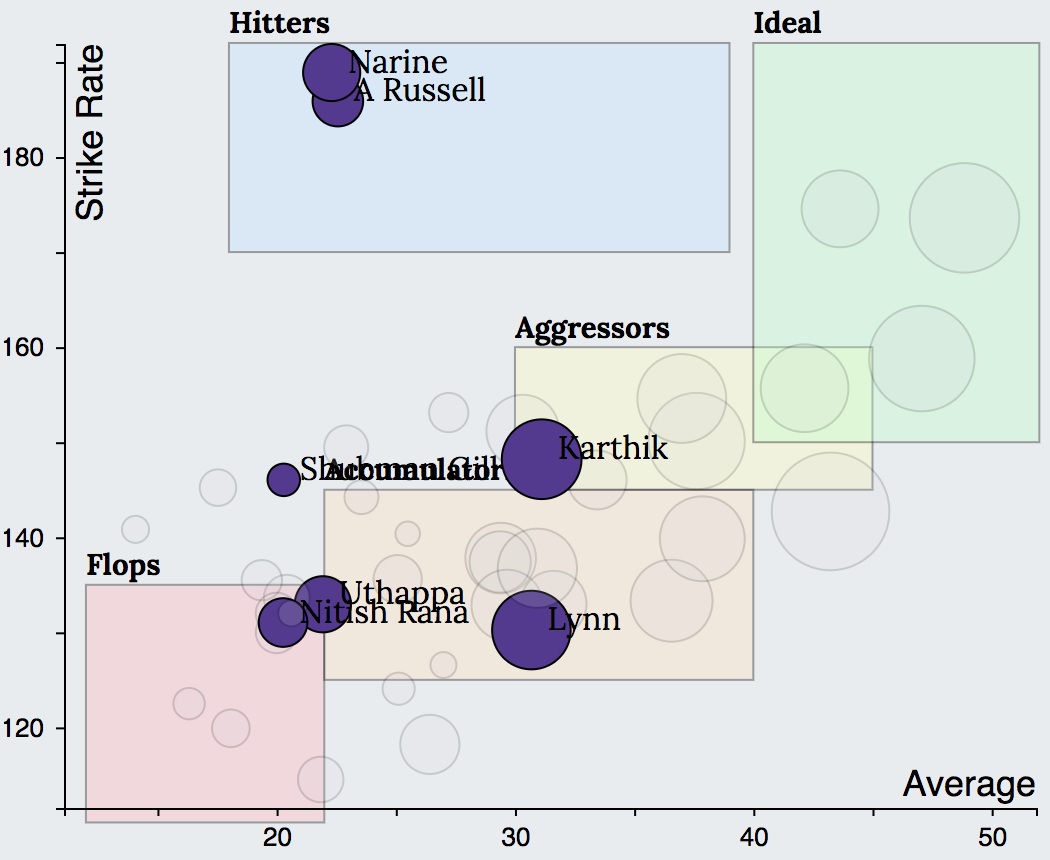
A quick glance at the batting charts of top ranked teams reveals that a minimum of four batsmen will need to score consistently throughout the season in order for the team to do well. While CSK had 3 Aggressors (Dhoni, Watson, Rayudu) and one Accumulator (Raina), Adelaide Strikers had 2 Aggressors (Carey, Head) and 2 Accumulators (Ingram, Weatherald). Worcestershire had 2 Aggressors (Joe Clarke, Guptill), 1 Accumulator (Ferguson) and 1 Ideal (Moeen Ali). KKR on the other hand seemed to have a wide variety of players suited for various stages of the game. They have 2 Hitters (Narine at top, Russell at the end of the innings), 1 Aggressor (Karthik) and 2 Accumulators (Lynn and Uthappa).
Based on these observations, we can infer that the batting line up of a successful team will consist of one of following combinations
- 3 Aggressors, 1 Accumulator
- 2 Aggressors, 2 Accumulators
- 1 Aggressor, 2 Accumulators, 1 or 2 hitters
It is vital that the batting strategies be appropriately adapted based on the different combinations of players and roles assigned to them. In case of multiple aggressors, one of them is expected to bat through most of the innings and score majority of team’s runs like Rayudu, Watson did for CSK. With only one aggressor, the team expects one of the hitters to provide momentum to the batting innings like Narine and Russell did for KKR and the accumulators to play around them.
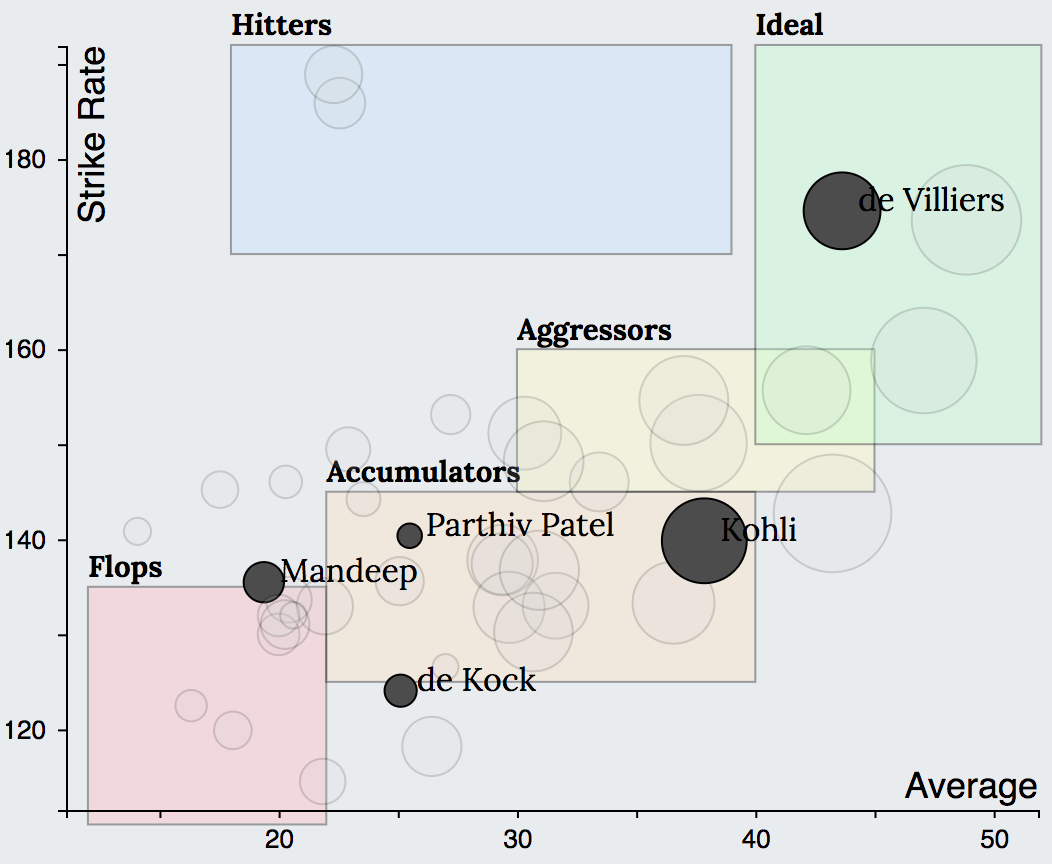
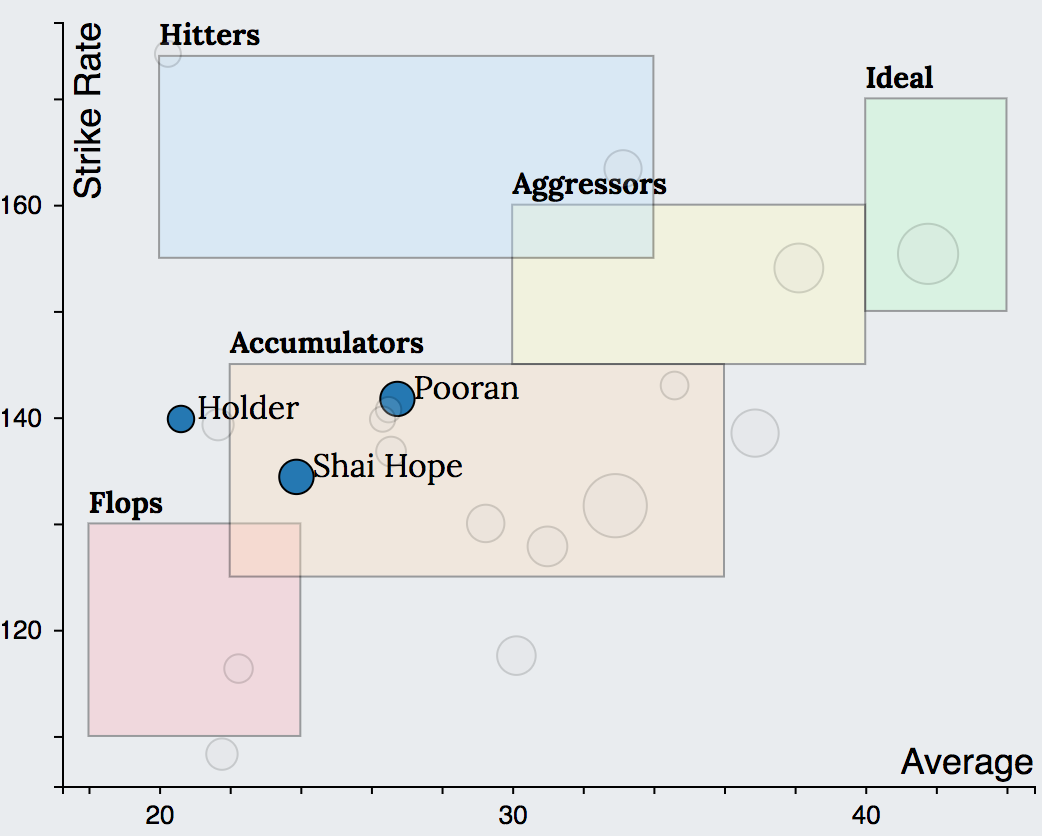
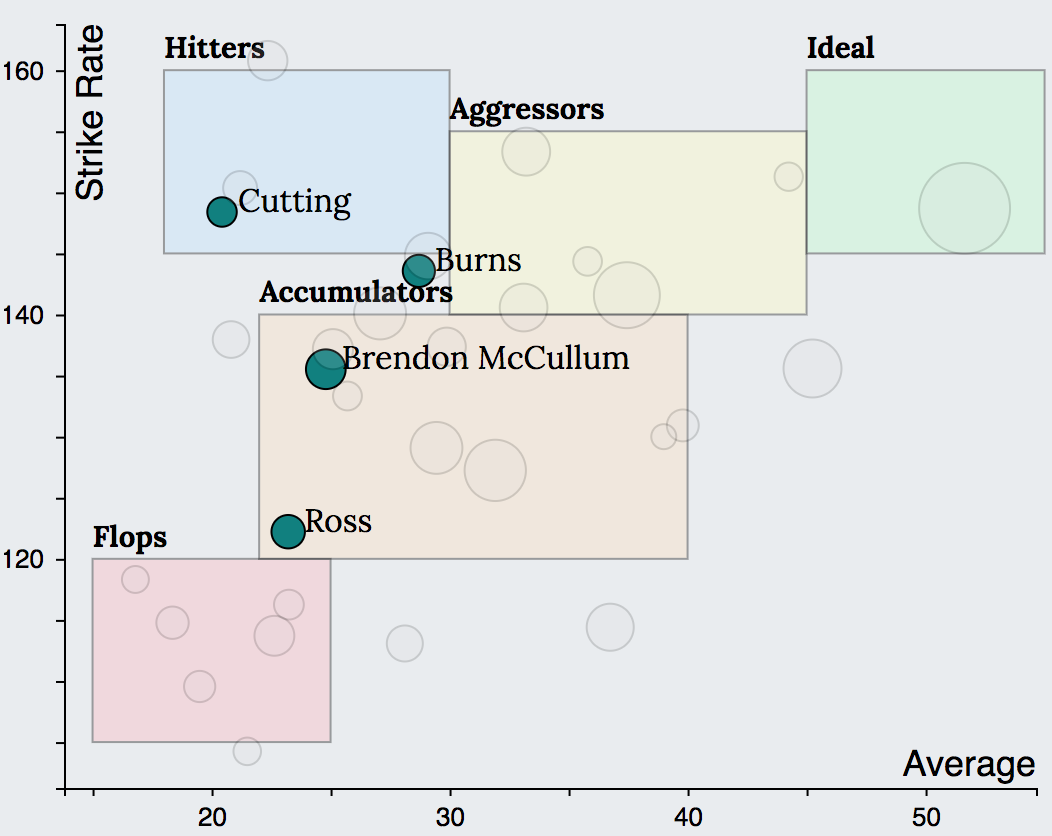
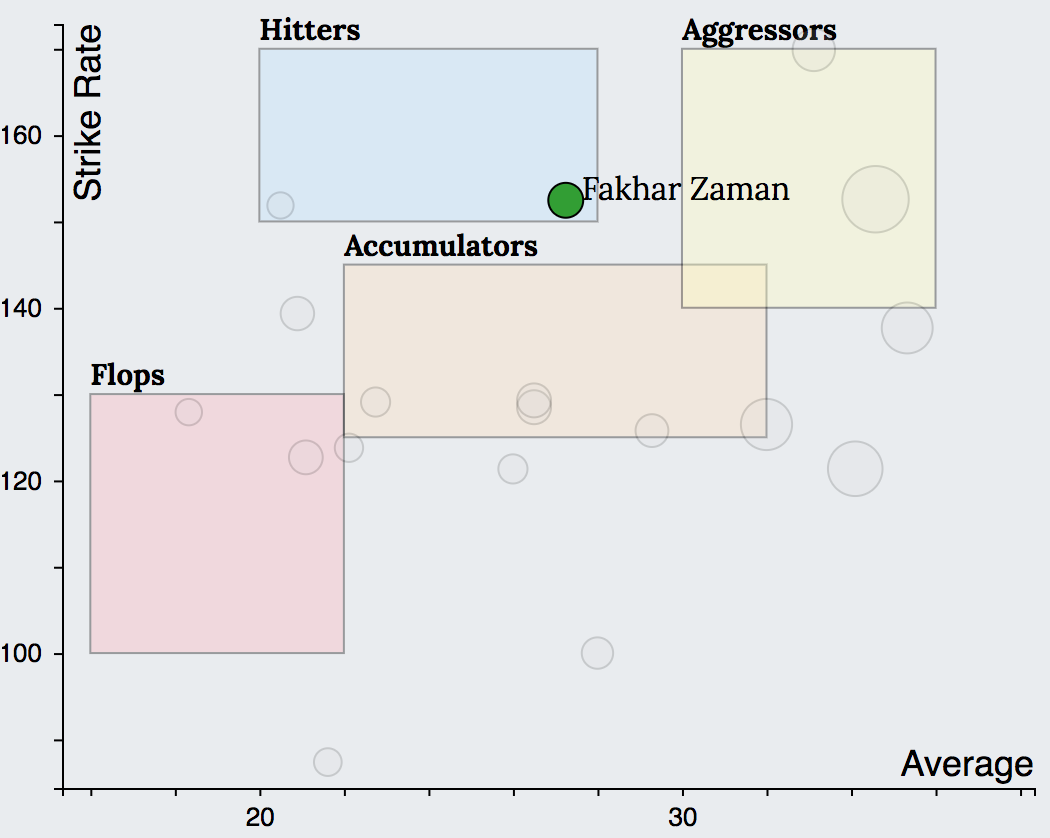
The batting charts of some of the bottom ranked teams show that such roles are clearly missing. While RCB had 1 Ideal (AB de Villiers) and 1 Accumulators (Kohli), very little support from other batsmen suggests lack of clearly assigned roles resulting in over reliance on their top two batsmen. This further puts the pressure on AB de Villiers and Kohli since they will need to perform the roles of both Accumulators and Aggressors. This is where assigning definite roles to different batsmen makes a massive difference to a team’s on field performance.
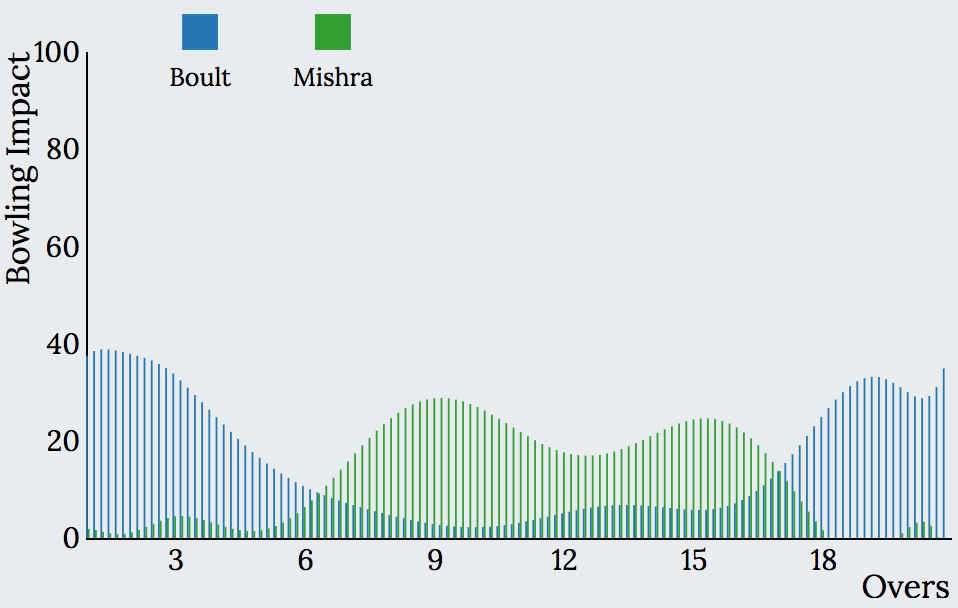
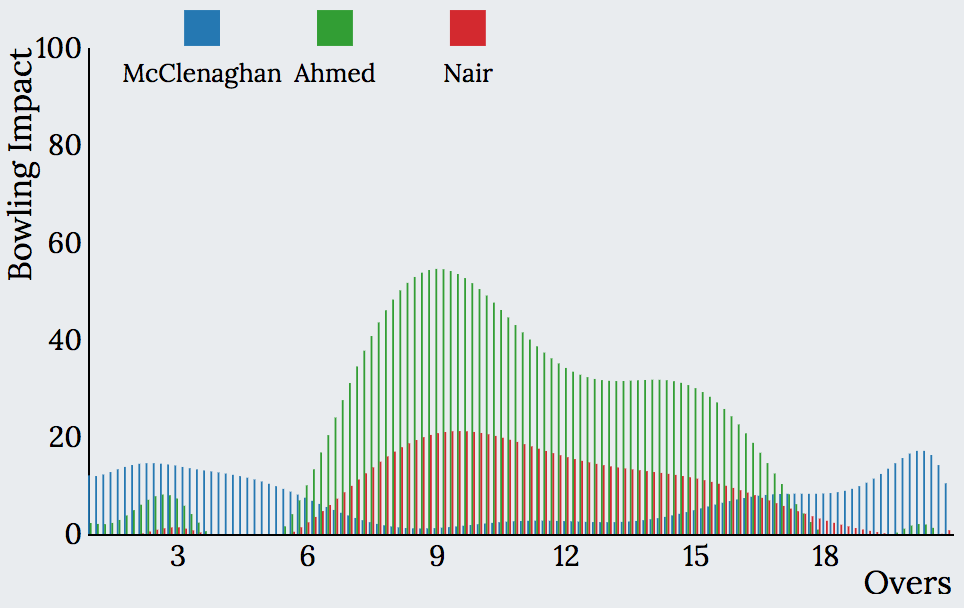
Now on to the bowler types charts of top and bottom ranked teams.
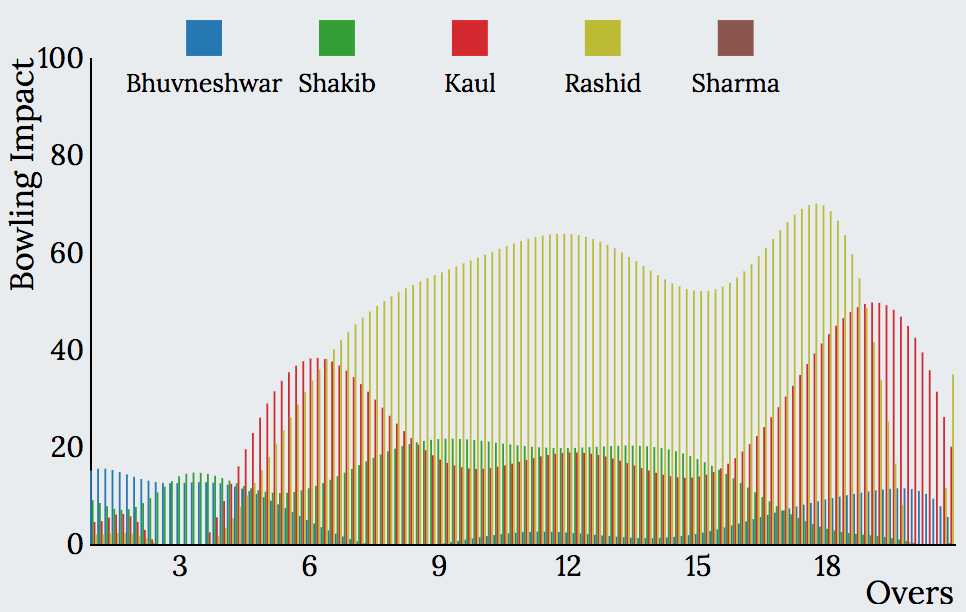
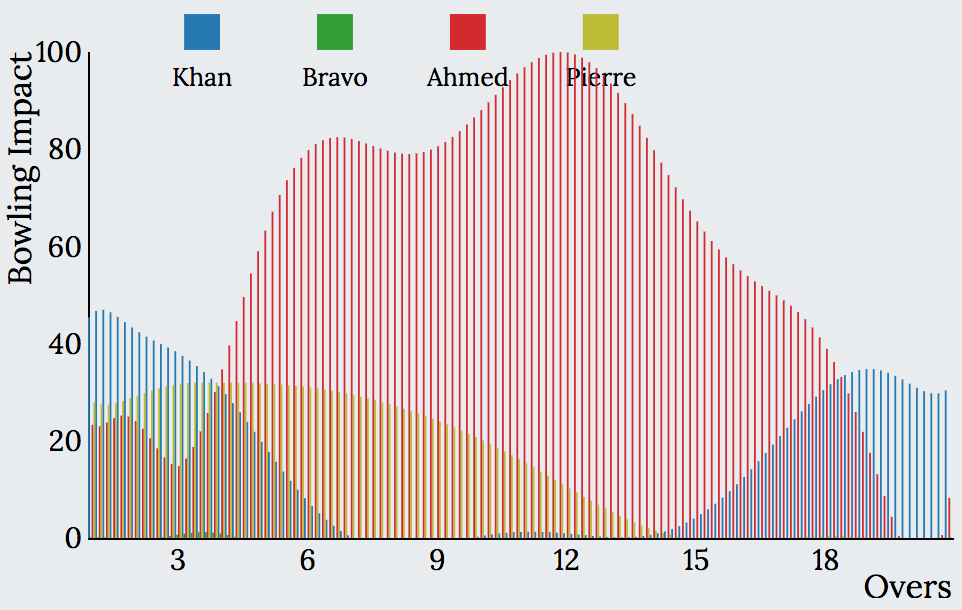
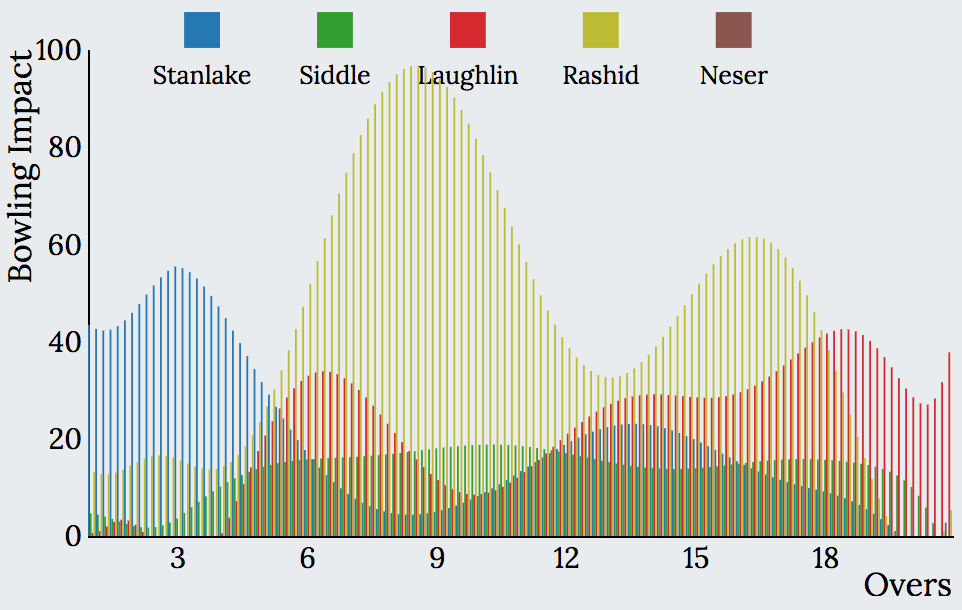
Bowling charts of top ranked teams
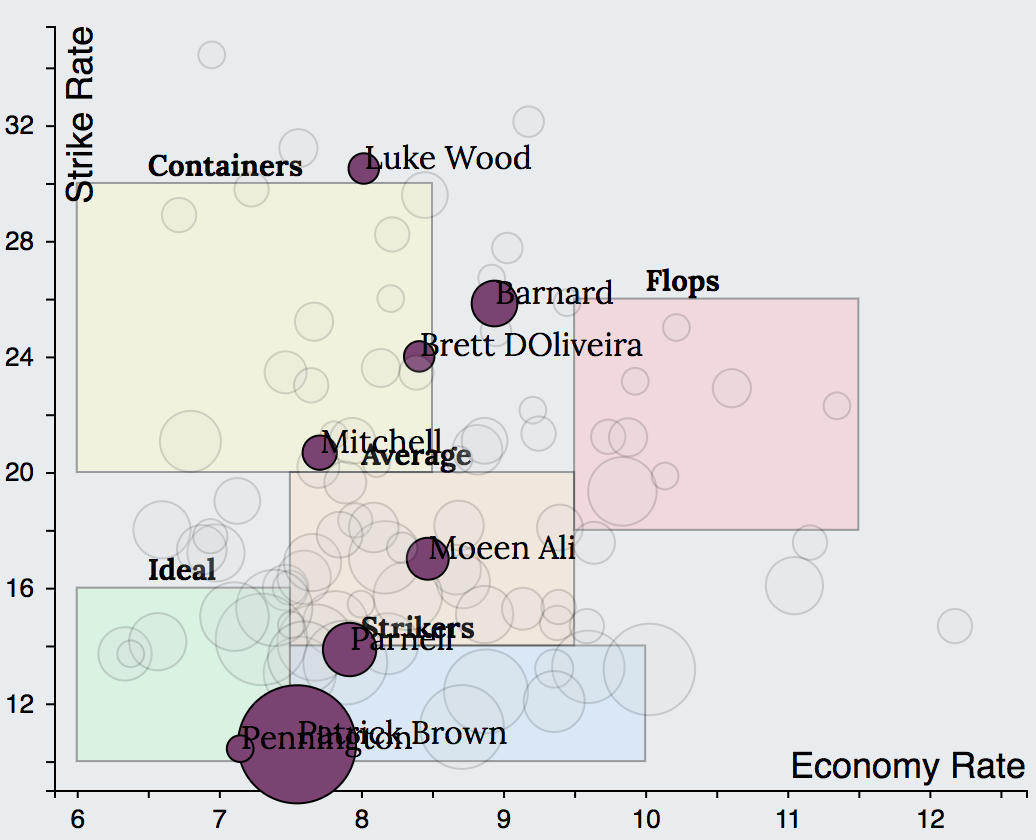
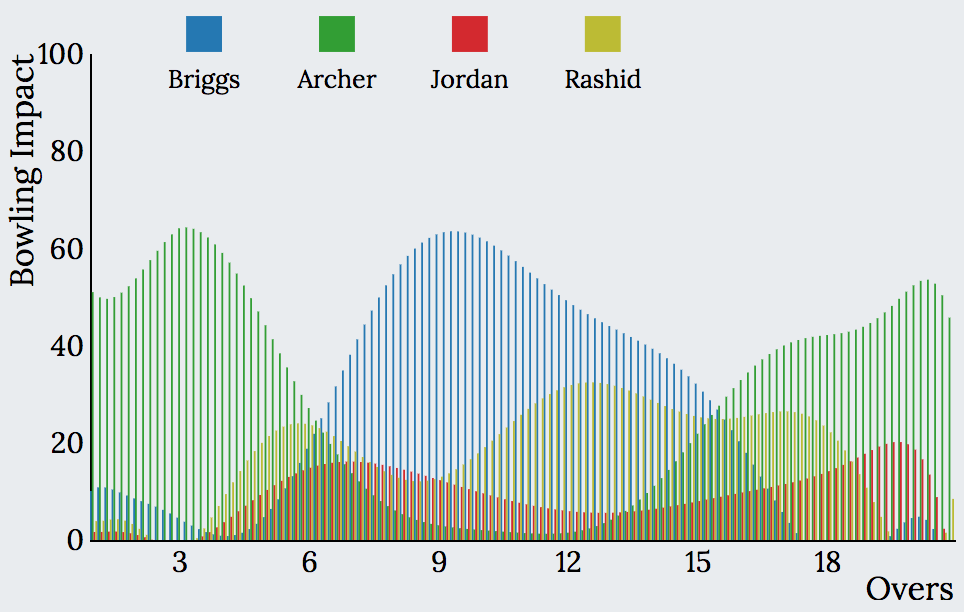
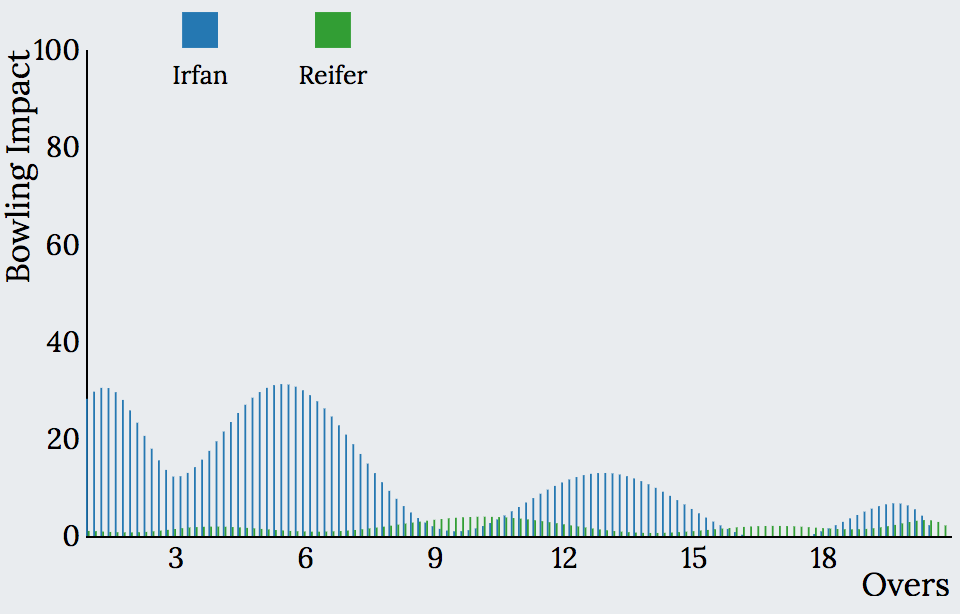
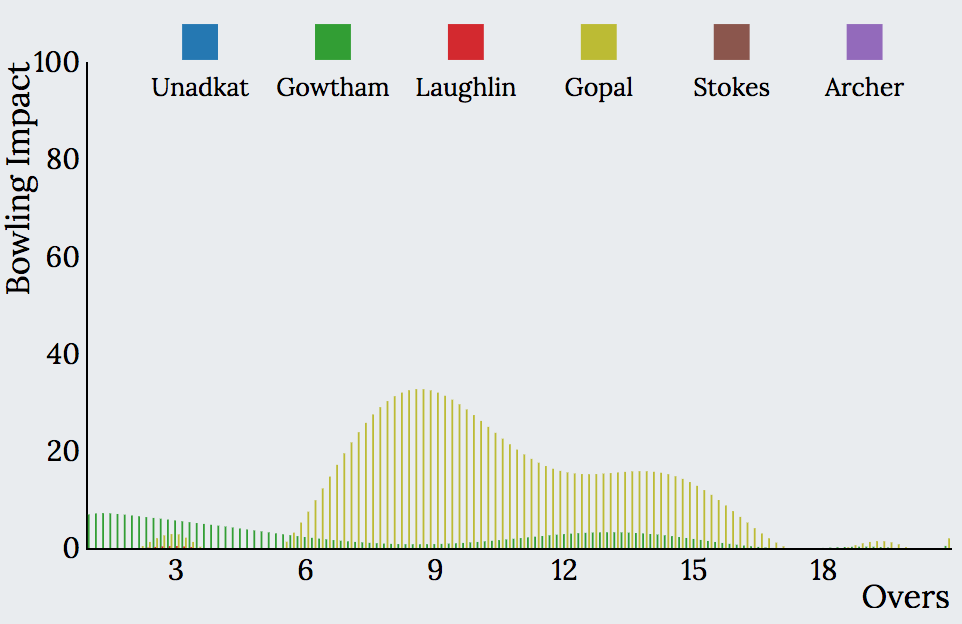
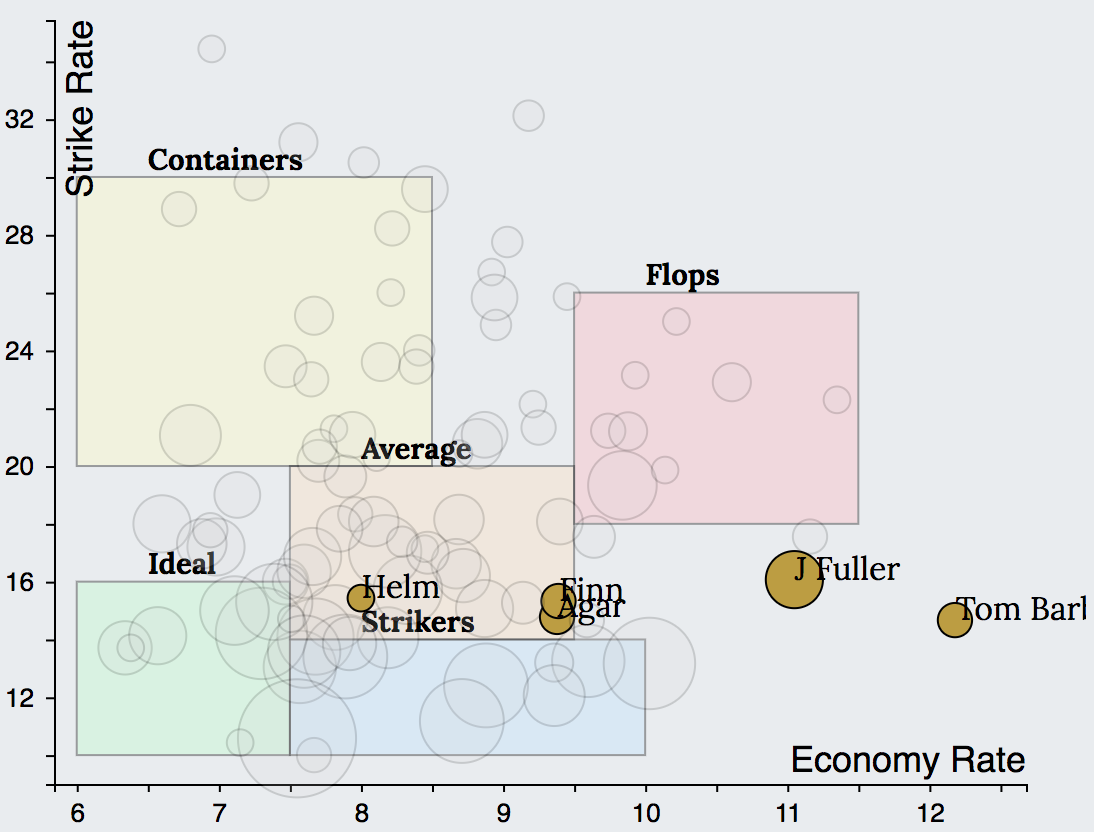
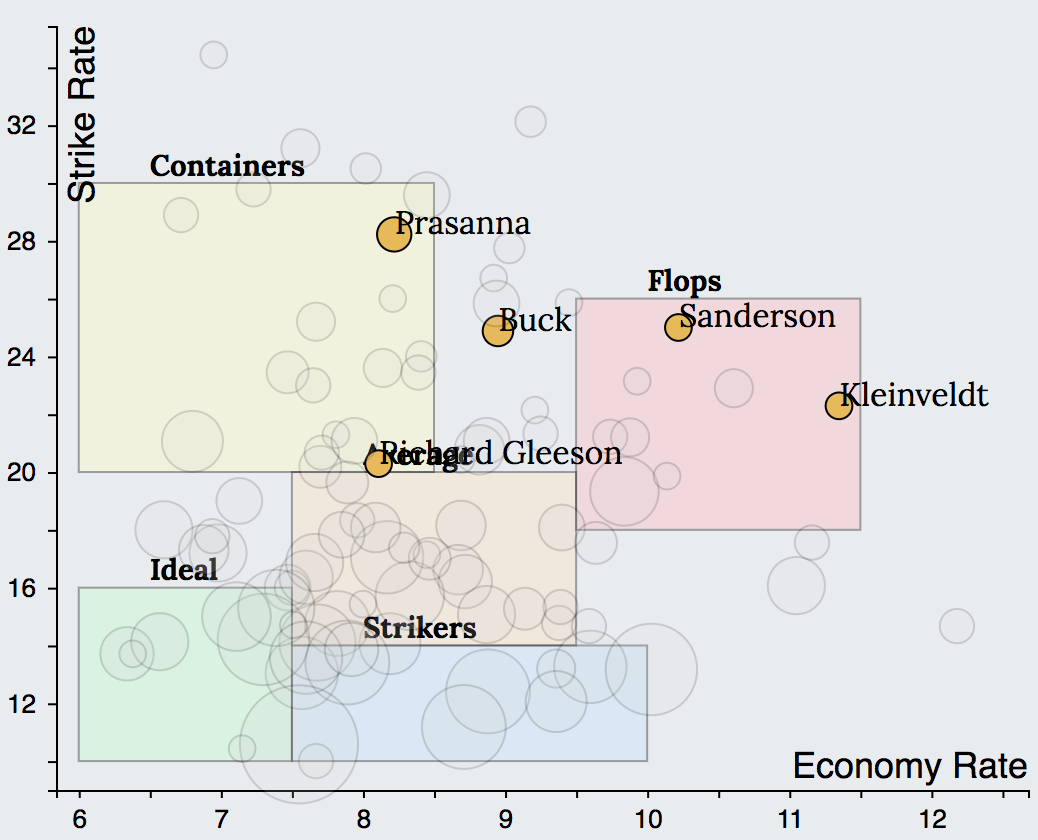
Bowling charts of bottom ranked teams
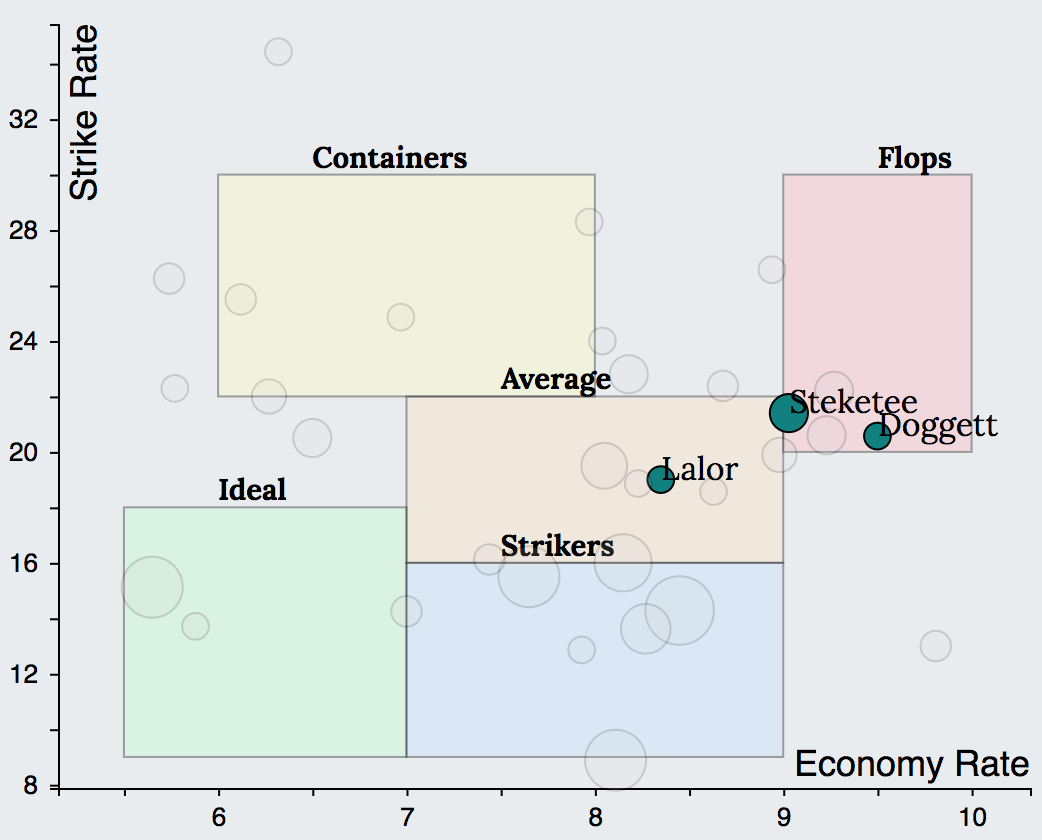
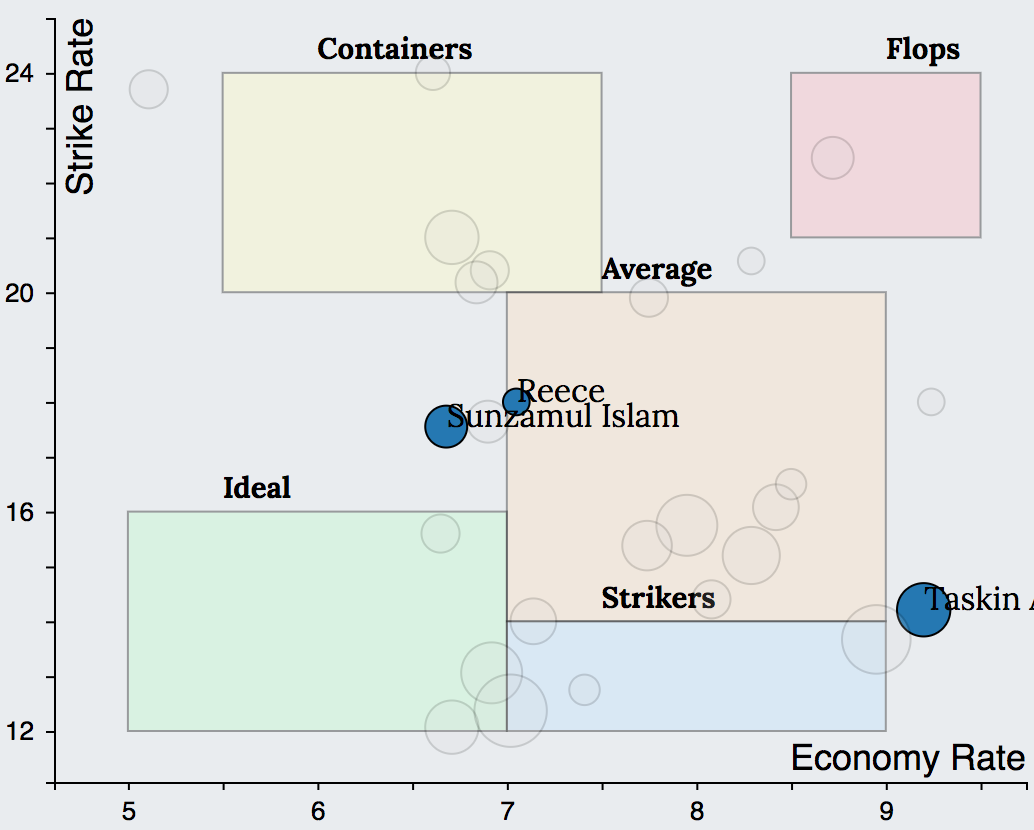
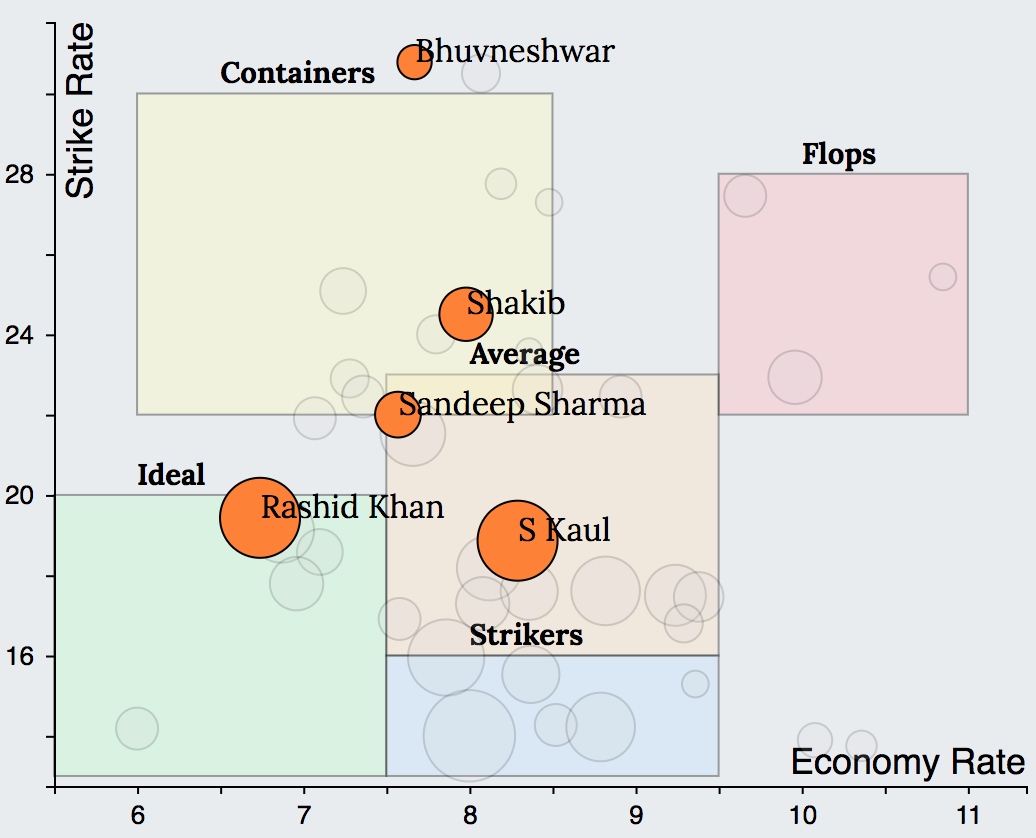
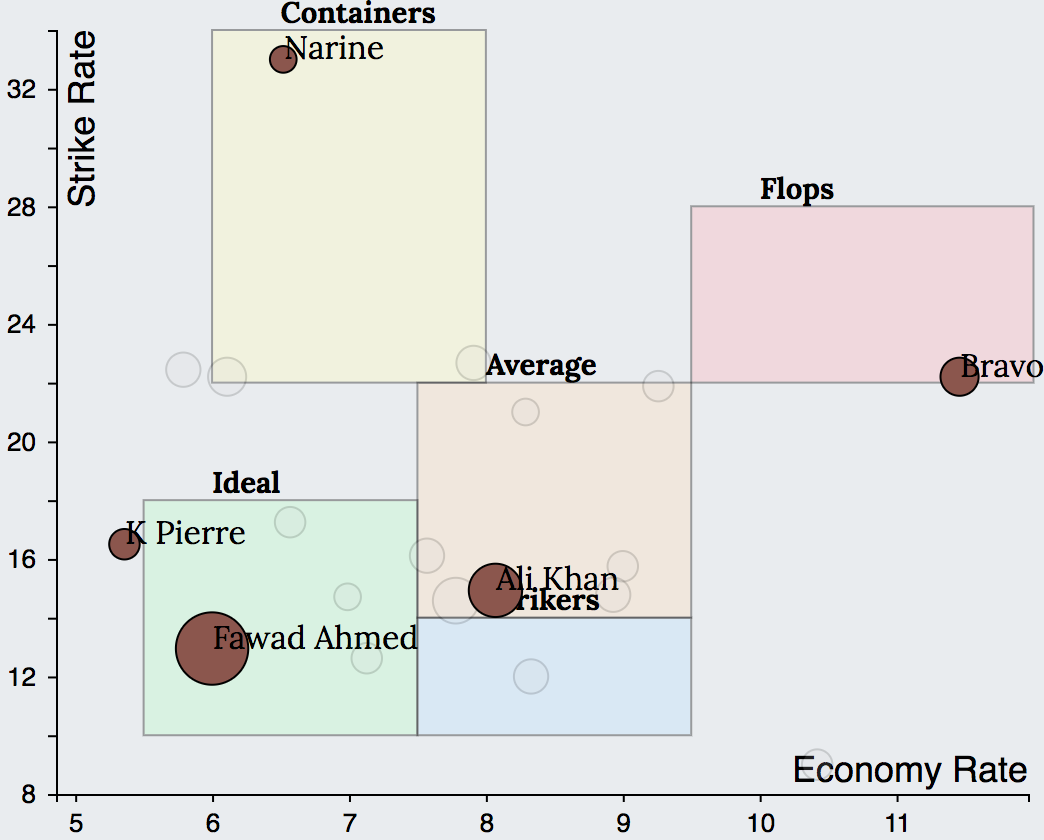
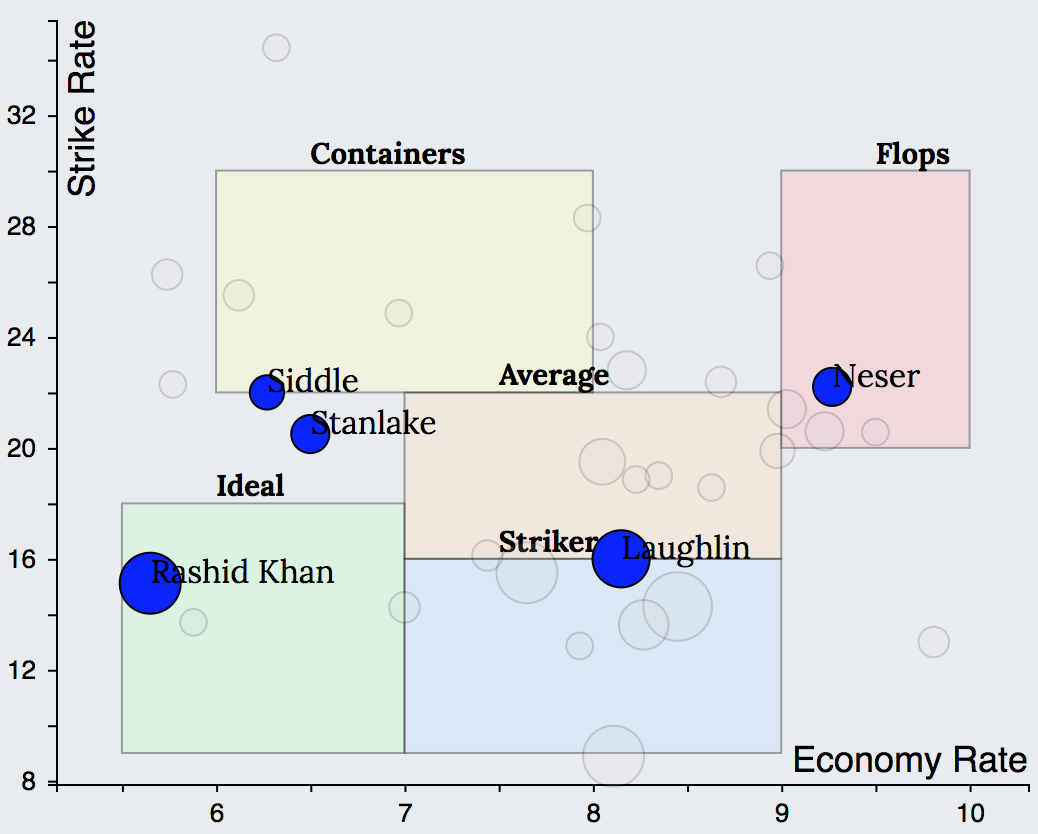
Similar to the batting charts, the bowling charts of few of the top ranked teams in the 2018 season reveals the following. SRH had 1 Ideal (Rashid) 2 Average (Sandeep, Kaul) and 2 Containers (Shakib, Bhuvaneshwar). Trinbago Knight Riders had 2 Ideals (K Pierre, Fawad Ahmed), 1 Average (Ali Khan) and 1 Container (Narine). Adelaide Strikers had 1 Ideal (Rashid), 1 Average (Laughlin) and 2 Containers (Siddle, Stanlake).
Based on these, we can infer that the bowling line up of a successful T20 team should consist of the following combination
- 1 Ideal, 2 Average and 2 Containers
- 1 Ideal, 1 Average, 1 Striker and 2 Containers
It is clear that such roles are missing in the bowling charts of bottom ranked teams leading to dismal bowling performances. While Brisbane and Middlesex for example had no bowler in Container or Striker category. Northamptonshire had two bowlers in Flops and no player in Average or Striker categories. Similar to batting, with no clear roles assigned, bowlers are often uncertain about going for wickets or containing runs, eventually leading to erroneous line and lengths.
This brings us to the end of the section on team composition. The batting and bowling charts of the top and bottom ranked teams from different leagues around the world illustrated that successful teams almost always have players performing different roles assigned to them. Absence of such clearly defined roles will invariably result in poor performances. Such insights if appropriately used by the team think tank can lead to a change in team’s batting or bowling strategy which in turn will lead to better to better results.
Explore the interactive graph below to visualise the batting and bowling charts of your favourite team.